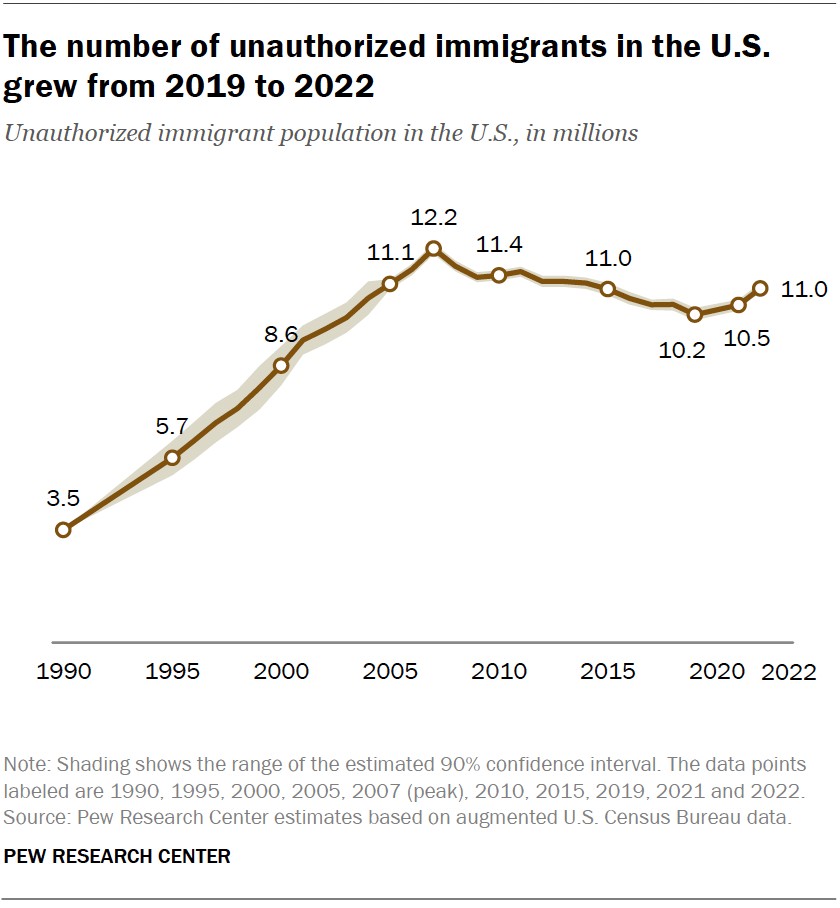
The question of “How Many Illegal Immigrants Are In The Us” is a complex one, sparking significant debate and policy discussions. Recent data provides crucial insights into this demographic, revealing shifts and trends that are essential for informed understanding. According to the latest estimates from the Pew Research Center, the unauthorized immigrant population in the United States reached 11.0 million in 2022. This figure, derived from the 2022 American Community Survey, marks a notable increase from 10.5 million in 2021 and signals a reversal of a previous downward trend observed between 2007 and 2019. This recent uptick represents the first sustained growth in the unauthorized immigrant population since the period spanning 2005 to 2007.
While this increase is significant, it’s important to contextualize it. The 2022 number remains below the peak of 12.2 million unauthorized immigrants recorded in 2007. Understanding these fluctuations and the factors behind them is crucial for a comprehensive grasp of the issue.
Methodology Behind the Estimates
To accurately estimate the number of unauthorized immigrants, organizations like the Pew Research Center employ a “residual method.” This approach is also utilized by the U.S. Department of Homeland Security’s Office of Immigration Statistics and non-governmental bodies like the Center for Migration Studies and the Migration Policy Institute. The consistency across these estimations strengthens the reliability of the data. This method is further validated by its alignment with official U.S. data sources, including birth records, school enrollment figures, tax data, and even census and survey data from Mexico.
The residual method involves a series of steps:
- Estimating the Total Immigrant Population: This involves using data from U.S. censuses and government surveys such as the American Community Survey and the Current Population Survey to determine the total number of immigrants residing in the country during a specific year.
- Estimating the Lawful Immigrant Population: This step focuses on calculating the number of immigrants living in the U.S. legally. This is achieved by utilizing official records of immigrant and refugee admissions combined with demographic data like death and out-migration rates.
- Calculating the Unauthorized Immigrant Population: The final step involves subtracting the estimated number of lawful immigrants from the estimated total immigrant population. This subtraction provides the initial estimate of the unauthorized immigrant population.
To refine the estimate, an upward adjustment is applied to account for the undercounting that can occur in censuses and surveys, particularly among immigrant populations, and even more so for unauthorized immigrants. This adjustment ensures a more accurate representation of the total number.
Defining “Unauthorized Immigrant”
The term “unauthorized immigrant” is the standard terminology used by academic researchers, policy analysts, and the U.S. Department of Homeland Security’s Office of Immigration Statistics. It’s crucial to understand that this term is synonymous with other terms often used in public discourse, such as “undocumented immigrants,” “illegal immigrants,” and “illegal aliens.” While the terminology can be debated, the underlying meaning refers to the same population group: individuals residing in the United States without legal authorization.
Who is Included in the Unauthorized Immigrant Population?
The unauthorized immigrant population encompasses immigrants who do not fall into specific legally authorized categories. These excluded categories include:
- Lawful Permanent Residents: Immigrants admitted for lawful permanent residence, often referred to as green card holders.
- Refugees: Individuals formally admitted as refugees seeking protection from persecution.
- Asylees: People granted asylum due to well-founded fears of persecution in their home countries.
- Legalized Immigrants under IRCA: Former unauthorized immigrants who gained legal residence under the 1985 Immigration Reform and Control Act.
- Naturalized Citizens: Immigrants from categories 1-4 who have become naturalized U.S. citizens.
- Lawful Temporary Residents: Individuals admitted under specific temporary visa categories, such as foreign students, guest workers, and intracompany transfers.
It is important to note that the Pew Research Center’s 2022 estimate includes over 3 million immigrants who, while lacking permanent legal status, have temporary protection from deportation and permission to be in the United States. These individuals, accounting for almost 30% of the total estimate, are often in legal limbo, and their status can be precarious depending on policy changes. They are included in the unauthorized immigrant count because they have not been granted lawful permanent residency.
These protections can arise from various circumstances:
- Asylum Seekers: Individuals who have applied for asylum and are awaiting a decision on their case are not considered legal residents but are also protected from deportation during the application process. Asylum claims can be affirmative (initiated by the individual) or defensive (filed in response to deportation proceedings). As of July 2022, there were substantial backlogs in both affirmative and defensive asylum cases, involving hundreds of thousands of individuals.
- Temporary Protected Status (TPS): TPS is granted to individuals from designated countries facing conditions that prevent their safe return, such as civil unrest, violence, or natural disasters. As of July 2022, approximately 650,000 unauthorized immigrants had TPS.
- Deferred Action for Childhood Arrivals (DACA): DACA provides protection from deportation to individuals brought to the U.S. as children before 2007. In July 2022, around 595,000 individuals were active DACA beneficiaries.
- Victims of Trafficking and Crime (T and U Visas): Victims of human trafficking and certain crimes who cooperate with law enforcement may be eligible for T and U visas. Significant backlogs exist for these visas, and applicants in the backlog are counted within the unauthorized immigrant population.
While these forms of temporary protection offer a degree of security, the individuals holding them are still classified as unauthorized immigrants under standard definitions because they lack permanent legal residency.
Recent Trends and Factors Influencing Population Changes
The 2022 estimates do not capture more recent shifts in immigration patterns. Available data suggests that the unauthorized immigrant population in the U.S. has likely increased since mid-2022. Several factors point to this potential growth:
- Increased Border Encounters: U.S. border encounters with migrants reached record highs throughout 2022 and 2023. While not all encounters result in individuals remaining in the U.S. without authorization, a significant number do.
- Growing Asylum Backlogs: The number of individuals awaiting decisions on asylum claims increased by approximately 1 million by the end of 2023, adding to the population residing in the U.S. with pending legal status.
- New Parole Programs: Federal programs like the Cuban, Haitian, Nicaraguan, and Venezuelan (CHNV) parole program and Uniting for Ukraine (U4U) have paroled hundreds of thousands of new immigrants into the country. While these programs offer temporary legal pathways, individuals entering through parole are generally considered part of the unauthorized immigrant population until they obtain permanent legal status.
It’s crucial to understand that simply adding new arrivals to existing estimates does not provide a complete picture. The unauthorized immigrant population is dynamic. Factors like outmigration, deaths, and transitions to legal status constantly influence the overall numbers.
Key Findings on Recent Changes (2019-2022)
The Pew Research Center’s analysis highlights several key shifts in the unauthorized immigrant population between 2019 and 2022:
- Decline in Mexican Unauthorized Immigrants: The number of unauthorized immigrants from Mexico decreased to 4.0 million in 2022, a significant drop from the peak of 6.9 million in 2007. Despite this decrease, Mexico remains the largest single country of origin for unauthorized immigrants in the U.S.
- Growth from Diverse Regions: The unauthorized immigrant population grew from nearly every region globally between 2019 and 2022. Notably, increases were observed from the Caribbean, South America, Asia, Europe, and sub-Saharan Africa.
- State-Level Changes: Six states experienced growth in their unauthorized immigrant populations: Florida, Maryland, Massachusetts, New Jersey, New York, and Texas. California was the only state that saw a decrease.
- Workforce Participation Increase: The number of unauthorized immigrants in the U.S. workforce rose to 8.3 million in 2022, up from 7.4 million in 2019, reaching levels comparable to previous highs in 2008 and 2011.
Composition of the Immigrant Population
Immigrants constitute a significant portion of the U.S. population. In 2022, immigrants made up 14.3% of the nation’s total population, a share slightly higher than in the preceding five years but still below the historical high of 14.8% in 1890.
Within the immigrant population, unauthorized immigrants represent a notable segment. As of 2022, unauthorized immigrants accounted for 3.3% of the total U.S. population and 23% of the foreign-born population. While these percentages are lower than the peak values recorded in 2007, they are slightly higher than in 2019, reflecting the recent population growth.
Conversely, the lawful immigrant population has shown steady growth, increasing from 24.1 million in 2000 to 36.9 million in 2022. This growth has been largely driven by a significant rise in the number of naturalized citizens, who increased from 10.7 million to 23.4 million during the same period.
Households and Families
Unauthorized immigrants reside in approximately 6.3 million households across the U.S., impacting over 22 million people. These households represent 4.8% of all U.S. households. Key characteristics of these households include:
- Immigrant Presence: In 86% of these households, either the householder or their spouse is an unauthorized immigrant.
- Mixed-Status Households: Nearly 70% are “mixed-status” households, meaning they include lawful immigrants or U.S.-born residents in addition to unauthorized immigrants.
- Relationship to Householder: In only about 5% of households, unauthorized immigrants are not related to the householder or spouse, suggesting they may be employees or roommates.
Of the 22 million individuals living in households with unauthorized immigrants, approximately half (11 million) are U.S.-born citizens or lawful immigrants. This includes:
- U.S.-born Adult Children: 1.3 million U.S.-born adults who are children of unauthorized immigrants and still live with their parents.
- Other U.S.-born and Lawful Immigrant Adults: 1.4 million other U.S.-born adults and 3.0 million lawful immigrant adults residing in these households.
- U.S.-born Children: A significant number, 4.4 million U.S.-born children under 18 live with an unauthorized immigrant parent. These children constitute the vast majority (84%) of all minor children living with an unauthorized immigrant parent.
- Unauthorized Immigrant Children: Approximately 850,000 children under 18 are themselves unauthorized immigrants as of 2022.
The prevalence of households with unauthorized immigrants varies significantly across states, ranging from less than 1% in states like Maine and West Virginia to a high of 9% in Nevada, followed by California, New Jersey, and Texas at 8% each.
Countries of Origin
The countries of origin for unauthorized immigrants have evolved since the population peak in 2007.
- Mexico: While still the largest single origin country, the number of unauthorized immigrants from Mexico has significantly decreased. In 2022, 4.0 million unauthorized immigrants were from Mexico, the lowest number since the 1990s, and representing the smallest share on record (37% of the total). This decline is attributed to factors like decreased migration from Mexico to the U.S., returns to Mexico, and expanded legal immigration opportunities for Mexicans, particularly for temporary agricultural work.
- Other Regions: In contrast to Mexico, the number of unauthorized immigrants from countries other than Mexico grew rapidly between 2019 and 2022, increasing from 5.8 million to 6.9 million. Almost every world region saw an increase, with the largest from the Caribbean and Europe/Canada. Central America, which had previously been a major source of growth, remained relatively stable during this period.
The countries with the largest unauthorized immigrant populations in the U.S. after Mexico in 2022 were:
-
El Salvador (750,000)
-
India (725,000)
-
Guatemala (675,000)
-
Honduras (525,000)
-
The Northern Triangle: El Salvador, Honduras, and Guatemala – collectively known as the Northern Triangle – accounted for 1.9 million unauthorized immigrants in 2022, about 18% of the total. While this population grew significantly between 2007 and 2019, growth slowed after 2019.
-
Venezuela and Other Origins: Venezuela has emerged as a country with rapid growth in its unauthorized immigrant population in the U.S., reaching 270,000 in 2022. Other countries experiencing growth include Brazil, Canada, Colombia, Ecuador, India, and countries of the former Soviet Union. However, some countries with significant unauthorized immigrant populations, such as China, the Dominican Republic, and the Philippines, showed no significant change between 2019 and 2022.
States of Residence
While most states saw little change in their unauthorized immigrant populations between 2019 and 2022, six states experienced notable growth: Florida, Texas, New York, New Jersey, Massachusetts, and Maryland. California was the only state to experience a decrease.
The states with the largest unauthorized immigrant populations in 2022 remained consistent with historical trends:
- California (1.8 million)
- Texas (1.6 million)
- Florida (1.2 million)
- New York (650,000)
- New Jersey (475,000)
- Illinois (400,000)
These six states accounted for 56% of the nation’s unauthorized immigrants in 2022, a decrease from 80% in 1990, indicating a broader geographic distribution over time. Notably, while California historically held a significantly larger unauthorized immigrant population than Texas, the gap has narrowed considerably due to population decreases in California and increases in Texas.
Labor Force Participation
Unauthorized immigrants are a significant part of the U.S. labor force. The number of unauthorized immigrants in the workforce increased from 7.4 million in 2019 to 8.3 million in 2022, representing about 4.8% of the total U.S. workforce. This share is slightly below the peak of 5.4% in 2007 but has remained relatively stable between 4.4% and 5.4% since 2003.
The higher share of unauthorized immigrants in the workforce compared to their share of the total population (3.3%) reflects the demographic composition of this group, which includes fewer children and elderly adults, who are less likely to be in the labor force.
Workforce participation rates vary by state. States with the highest shares of unauthorized immigrants in their workforce in 2022 include Nevada, Texas, Florida, New Jersey, California, and Maryland. Conversely, states like Maine, Montana, Vermont, and West Virginia have very low shares (less than 1%).
Conclusion
Understanding “how many illegal immigrants are in the US” requires a nuanced approach that goes beyond a single number. The latest data reveals a complex picture of a population that is dynamic and influenced by various factors, including economic conditions, policy changes, and global events. While the unauthorized immigrant population has recently increased, it remains below historical peaks, and its composition and geographic distribution continue to evolve. Continued monitoring and analysis are crucial for informed public discourse and effective policymaking related to immigration in the United States.