Are you looking to master project estimation and boost your team’s productivity? On HOW.EDU.VN, we provide a detailed guide on How To Calculate Velocity, understand its importance, and use it to enhance your project management skills. Learn about agile velocity, velocity measurement, and velocity tracking to optimize your team’s performance.
1. What is Velocity and How Do You Calculate It?
Velocity, in the context of project management and agile methodologies, is a metric that measures the amount of work a team can complete during a single sprint. According to Scrum, Inc., it’s the key metric in Scrum. Calculating velocity involves totaling the points for all fully completed user stories in a sprint and then averaging this number over several sprints.
Team Velocity = Total Story Points Completed Per Sprint / Number of Sprints
1.1. Understanding the Core Components of Velocity
To accurately calculate velocity, it’s important to understand its core components. This includes defining story points, tracking sprint progress, and identifying factors that may influence your team’s output.
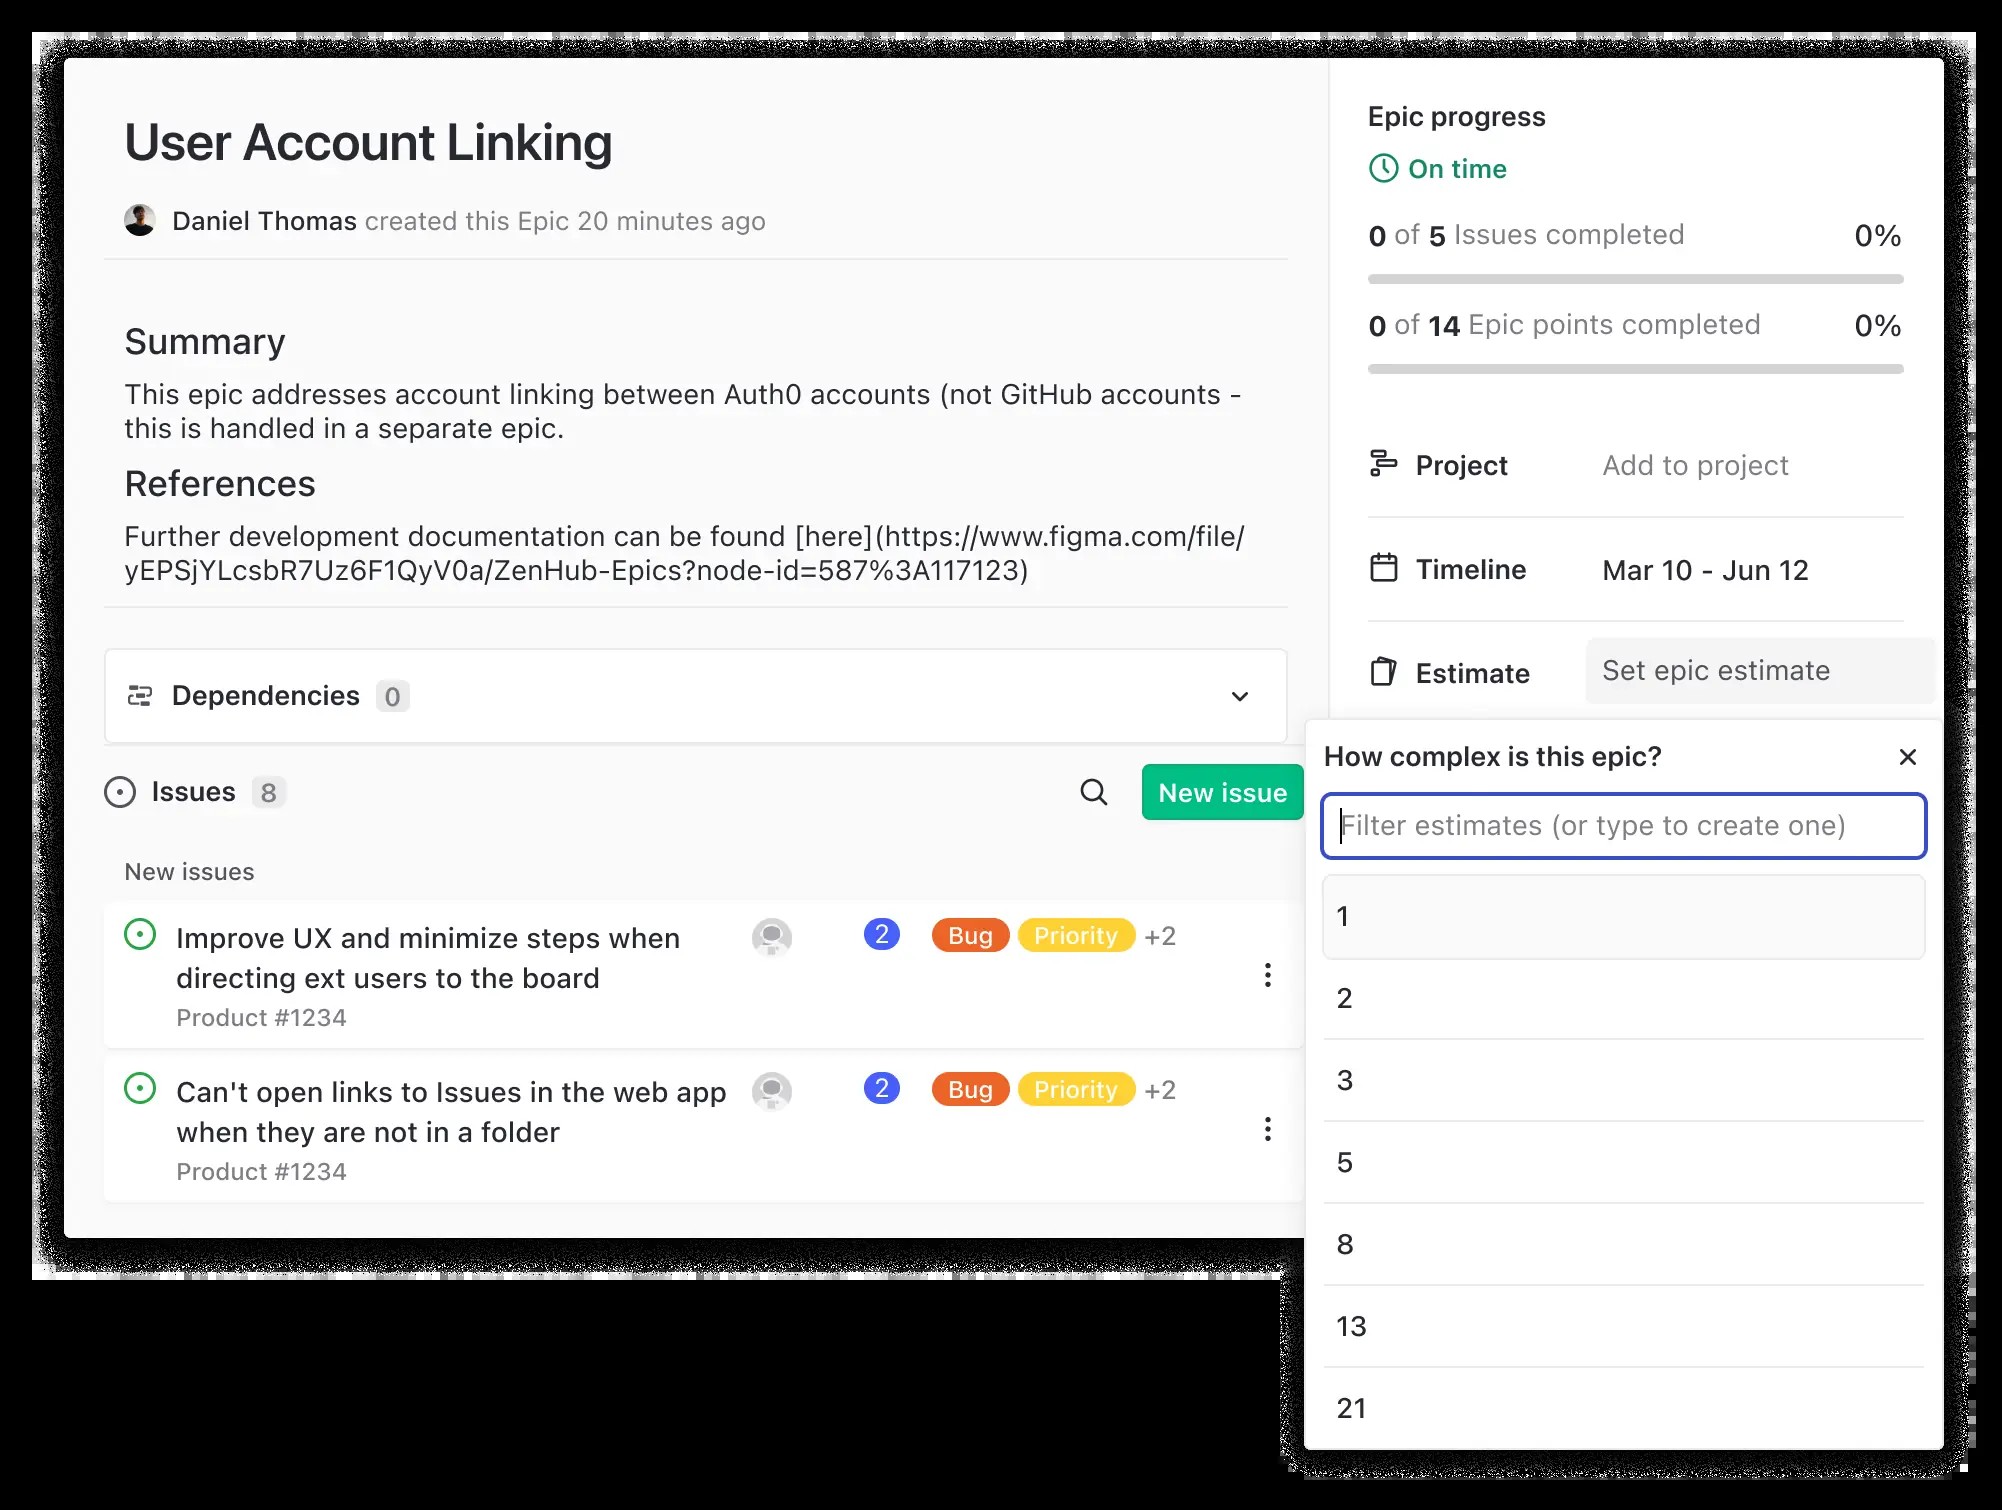
- Story Points: Story points are relative estimates of the effort required to complete a task. They are used to compare tasks in relation to other activities, helping teams understand the complexity and time needed for each item.
- Sprint: A sprint is a short, time-boxed period when a team works to complete a set amount of work. Sprints are typically two to four weeks long and are a fundamental part of agile methodologies.
- Completed User Stories: These are tasks or features that have been fully completed during a sprint. Only completed user stories are included in the velocity calculation.
1.2. Step-by-Step Guide to Calculating Velocity
Calculating velocity involves a few straightforward steps:
- Define Story Points: Assign story points to each task or user story in your backlog. This is a relative estimate of the effort required to complete the task.
- Complete a Sprint: Work through your sprint, ensuring that all tasks are tracked and updated as they are completed.
- Total Completed Story Points: At the end of the sprint, total the story points for all fully completed user stories.
- Calculate Average Velocity: Over several sprints, calculate the average number of story points completed per sprint. This average is your team’s velocity.
1.3. Illustrative Examples of Velocity Calculation
To better illustrate how to calculate velocity, let’s look at a few examples:
Example 1:
- Sprint 1: Completed stories = 15 story points
- Sprint 2: Completed stories = 20 story points
- Sprint 3: Completed stories = 18 story points
- Average Velocity = (15 + 20 + 18) / 3 = 17.67 story points per sprint
Example 2:
- Sprint 1: Completed stories = 22 story points
- Sprint 2: Completed stories = 25 story points
- Sprint 3: Completed stories = 20 story points
- Sprint 4: Completed stories = 23 story points
- Average Velocity = (22 + 25 + 20 + 23) / 4 = 22.5 story points per sprint
1.4. Tools and Software for Velocity Tracking
Several tools and software solutions can help you track and calculate velocity. These tools often integrate with project management platforms to provide real-time data and insights.
| Tool | Description |
|---|---|
| Jira | A popular project management tool that offers robust features for tracking velocity, sprint progress, and story points. Jira provides detailed reports and charts to visualize team performance. |
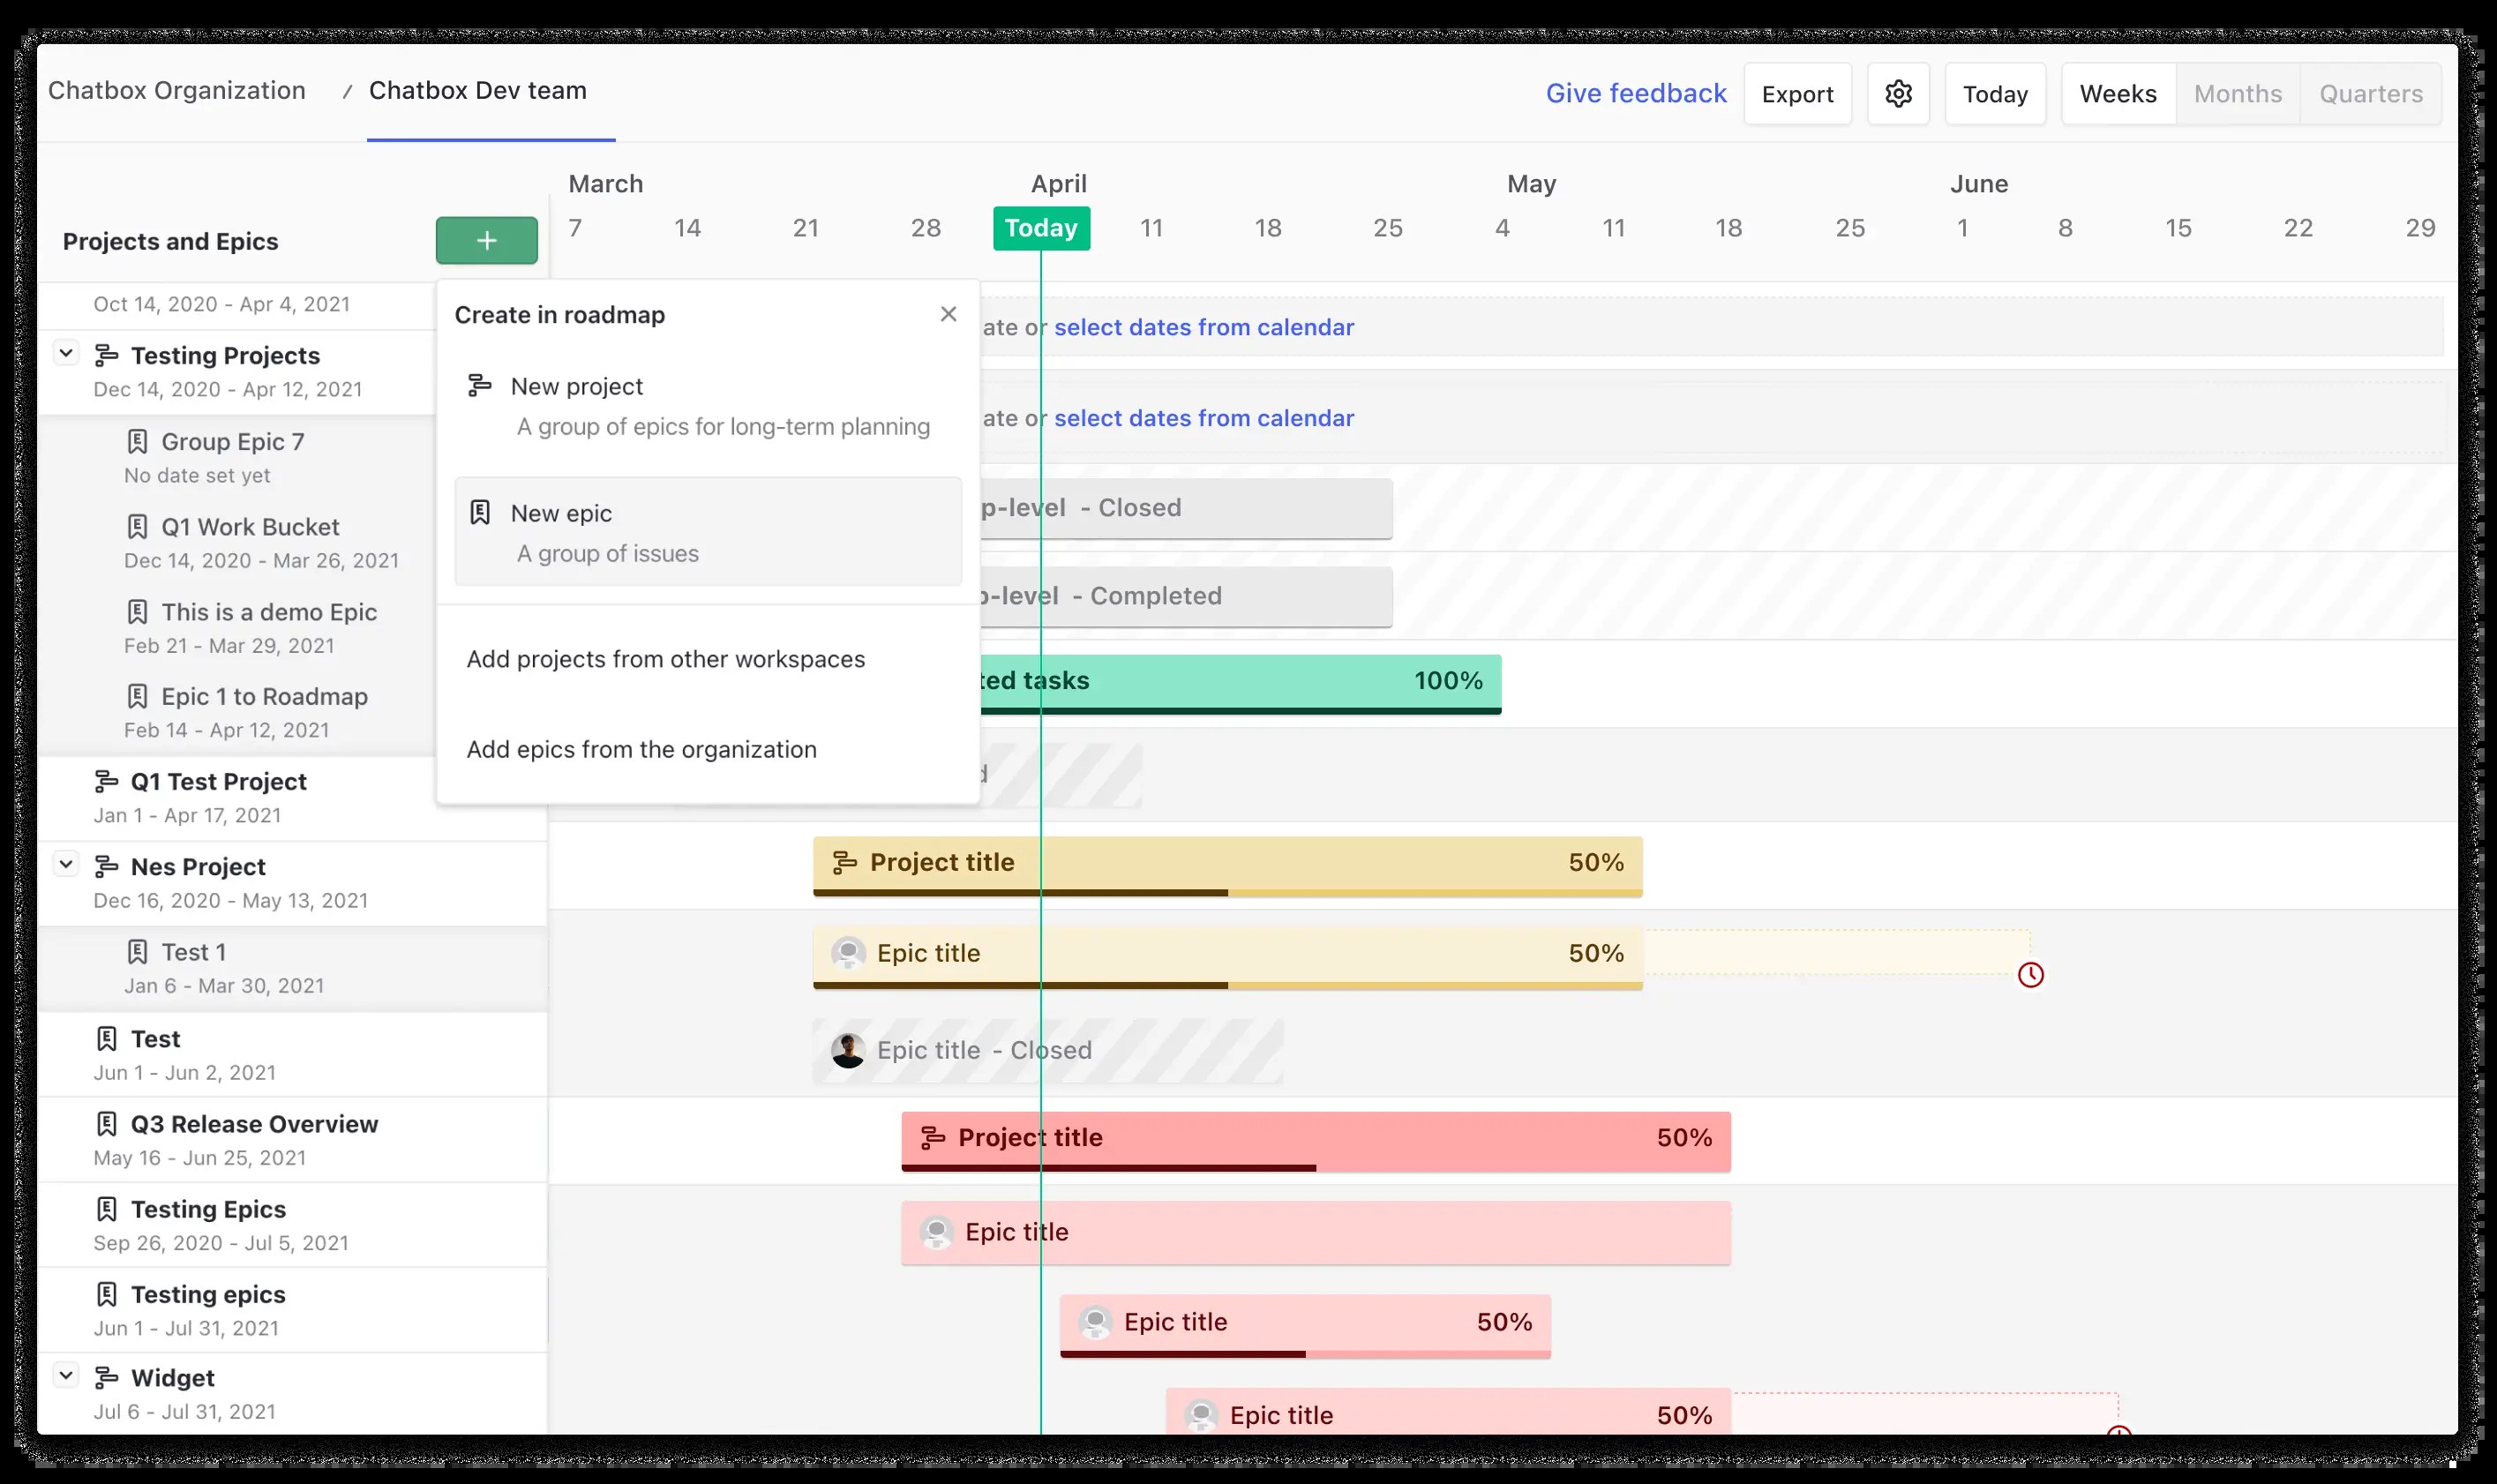
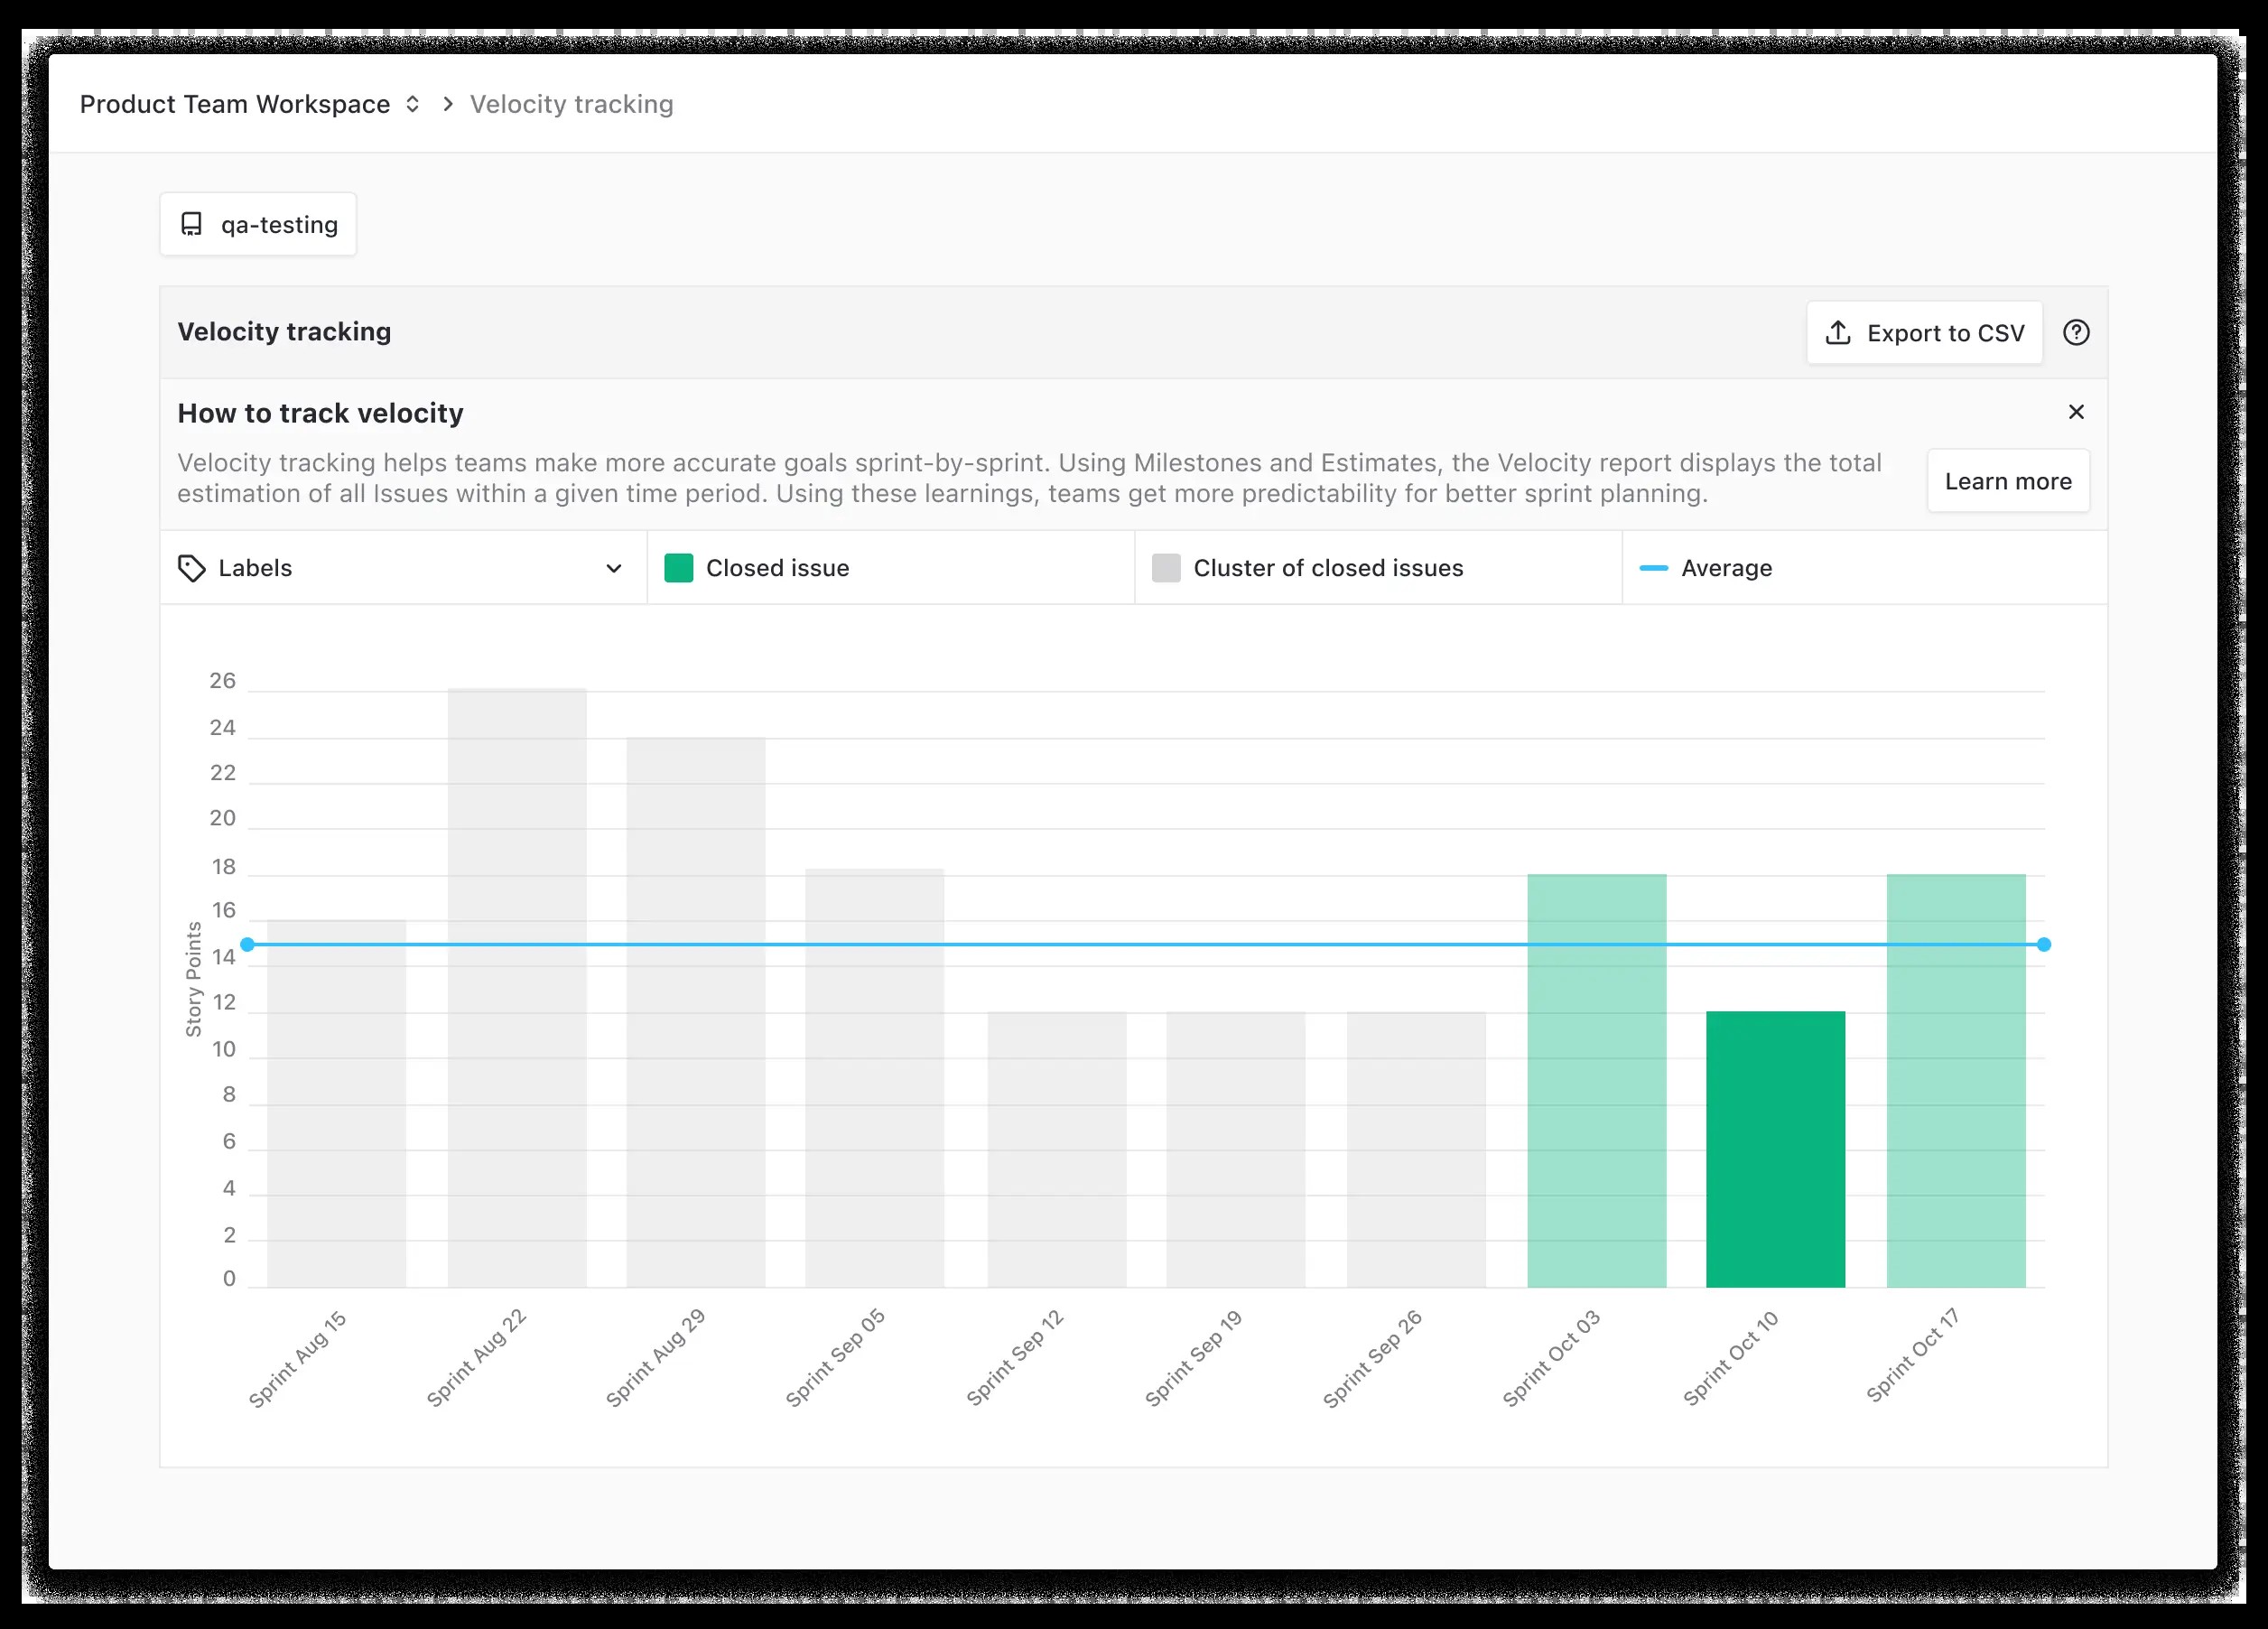
| Zenhub | A project management tool that integrates directly with GitHub. Zenhub offers velocity charts and burndown charts to monitor team performance and velocity visually. It uses live GitHub data to ensure accuracy. |
| Trello | A flexible and visual project management tool that can be customized to track velocity. Trello allows teams to create boards, lists, and cards to represent tasks and track their progress through sprints. |
| Asana | A project management tool that helps teams organize, track, and manage their work. Asana provides features for setting goals, assigning tasks, and monitoring progress, making it easier to track velocity and identify areas for improvement. |
| Azure DevOps | A suite of development tools and services that includes features for tracking velocity, managing sprints, and collaborating on code. Azure DevOps provides comprehensive reporting and analytics to help teams optimize their performance. |
| Monday.com | A customizable work operating system that allows teams to manage projects, track progress, and collaborate effectively. Monday.com offers visual dashboards and reporting tools to monitor velocity and identify trends in team performance. |
| VersionOne | An agile management platform that supports various agile methodologies, including Scrum and Kanban. VersionOne provides features for planning, tracking, and reporting on team velocity, helping organizations improve their agile practices. |
| Targetprocess | An agile project management tool that offers a visual and customizable platform for managing projects and tracking velocity. Targetprocess supports various agile frameworks and provides features for planning, execution, and reporting. |
| Pivotal Tracker | A project management tool designed for agile software development. Pivotal Tracker focuses on simplicity and collaboration, providing features for managing user stories, tracking velocity, and visualizing sprint progress. |
| Rally | An agile project management tool that supports various agile methodologies and provides features for planning, tracking, and reporting on team velocity. Rally offers comprehensive analytics and reporting capabilities to help teams optimize their performance. |
1.5. Common Pitfalls to Avoid When Calculating Velocity
While calculating velocity can be straightforward, there are common pitfalls to avoid:
- Including Incomplete Stories: Only include fully completed user stories in your velocity calculation. Incomplete stories should be carried over to the next sprint.
- Not Adjusting for External Factors: Be aware of external factors such as team member absences, unexpected bugs, or changes in project scope. These factors can impact velocity and should be considered when making future estimates.
- Using Velocity as a Performance Metric: Velocity should not be used as a performance metric to compare team members. It is a tool for estimating and planning, not for evaluating individual performance.
By understanding these core components, following the step-by-step guide, and avoiding common pitfalls, you can accurately calculate velocity and use it to improve your project management practices.
2. Why is Tracking Team Velocity Important?
Tracking team velocity is crucial for project management as it provides a realistic understanding of how long team members will need to complete certain tasks based on their complexity. It enables more accurate planning, helps in achieving goals, and offers valuable insights into team performance over time.
2.1. Enhanced Project Planning and Estimation
Tracking team velocity provides a realistic understanding of how long team members will need to complete certain tasks based on their complexity. Universally, individuals tend to overestimate the amount of work they can complete in a given time period. Measuring actual velocity – how much work is really accomplished – enables more accurate planning, making it more likely to achieve goals.
- Improved Accuracy: Historical data allows for better predictions by looking at past performance and adjusting expectations moving forward.
- Resource Allocation: Understanding velocity helps in allocating resources effectively, ensuring that the right people are working on the right tasks at the right time.
- Realistic Timelines: By knowing the team’s capacity, project managers can set realistic timelines and avoid overpromising on deliverables.
2.2. Identifying Trends and Patterns in Team Performance
Viewing work completed over time becomes a valuable piece of insight. Factors outside your control – a sick teammate, an unexpected bug – are bound to pop up. Life happens. However, tracking velocity over multiple sprints helps identify trends and patterns in team performance.
- Performance Fluctuations: If you notice that for some sprints you’re able to get 28 story points complete and others only 22, talk to your team to explore why this may be happening. Are you estimating inconsistently? Or are there other factors contributing to certain sprints being less productive than others?
- Continuous Improvement: By analyzing these trends, teams can identify areas for improvement and implement strategies to enhance their performance.
- Data-Driven Decisions: Tracking velocity provides data that can be used to make informed decisions about project scope, timelines, and resource allocation.
2.3. Preventing Risks and Issues
Tracking velocity helps prevent issues like not hitting deadlines or rushing the development process.
- Proactive Problem Solving: By monitoring velocity, project managers can identify potential issues early on and take corrective action to prevent delays.
- Risk Mitigation: Understanding the team’s capacity helps in mitigating risks associated with unrealistic timelines and resource constraints.
- Improved Quality: By avoiding the need to rush the development process, teams can maintain a focus on quality and deliver better results.
2.4. Effective Communication with Stakeholders
Tracking velocity enables better communication with stakeholders by providing realistic estimates and timelines.
- Transparency: Sharing velocity data with stakeholders provides transparency into the team’s progress and capacity.
- Managing Expectations: By setting realistic expectations based on velocity, project managers can avoid overpromising and ensure stakeholder satisfaction.
- Building Trust: Consistent delivery and accurate timelines build trust with stakeholders, fostering a collaborative and supportive environment.
3. How to Increase Team Velocity in Agile Projects?
Increasing team velocity in agile projects involves enhancing visibility, conducting high-impact daily scrum meetings, not skipping the retrospective, and focusing on system bottlenecks over individuals. By implementing these strategies, teams can improve their productivity and deliver value more quickly.
3.1. Enhancing Visibility and Transparency
To maintain collective team accountability, visibility is key. Wherever you’re tracking production progress, make sure that everyone is able to access that information and encourage them to document what’s necessary in order to keep velocity at top speed.
- Shared Access to Information: Ensure that all team members have access to the tools and data used to track progress and velocity.
- Encourage Documentation: Encourage team members to document their work and share relevant information with the team.
- Open Communication: Foster an environment of open communication where team members feel comfortable sharing updates, challenges, and insights.
3.2. Conducting High-Impact Daily Scrum Meetings
Daily meetings can often feel like a drag, creating major mental fatigue for your team. Make sure that you’re entering into these meetings with high energy and commitment to keeping them direct and productive.
- Focus on Key Updates: Keep daily scrum meetings focused on key updates, such as progress made, challenges encountered, and plans for the day.
- Time-Box the Meetings: Limit the duration of daily scrum meetings to ensure they are efficient and productive.
- Encourage Active Participation: Encourage all team members to actively participate and share relevant information.
3.3. Emphasizing the Importance of Retrospectives
When a sprint ends, it’s easy to want to move on to the next thing immediately. However, without a retrospective, there’s a higher chance of poor practices enduring, which will continue to slow down how fast your team can move forward. This is another opportunity for your team to share the responsibility and maintain an open line of communication.
- Regular Retrospectives: Conduct retrospectives at the end of each sprint to review the team’s performance and identify areas for improvement.
- Actionable Insights: Focus on generating actionable insights that can be implemented in future sprints.
- Continuous Improvement: Use retrospectives as an opportunity to continuously improve team processes and practices.
3.4. Focusing on System Bottlenecks Over Individuals
Improving a person’s individual performance is one way of tackling inefficiencies, but in many instances, it’s likely a case of a workflow or communication issue. If you’re frustrated and don’t know why features aren’t completed on time, take a beat and talk to your team about where the system may be failing them. This avoids any finger-pointing and encourages honest feedback.
- Identify Bottlenecks: Analyze the team’s workflow to identify any bottlenecks or inefficiencies.
- Address System Issues: Focus on addressing system issues rather than blaming individuals for delays or underperformance.
- Encourage Collaboration: Foster a collaborative environment where team members work together to solve problems and improve processes.
4. Real-World Applications of Velocity in Different Industries
Velocity is a valuable metric in various industries, including software development, construction, marketing, and healthcare. Understanding how velocity is applied in these different contexts can provide insights into its versatility and benefits.
4.1. Software Development
In software development, velocity is used to estimate the amount of work a team can complete in a sprint. This helps in planning releases, setting realistic timelines, and managing resources effectively.
- Sprint Planning: Velocity is used to determine the number of story points a team can commit to in a sprint.
- Release Planning: By tracking velocity over multiple sprints, project managers can estimate the time required to complete a release.
- Resource Management: Velocity helps in allocating resources effectively, ensuring that the right people are working on the right tasks.
4.2. Construction
In the construction industry, velocity can be used to measure the progress of a project over time. This helps in identifying delays, managing resources, and ensuring that the project stays on track.
- Progress Tracking: Velocity can be used to track the progress of various tasks, such as foundation work, framing, and finishing.
- Resource Allocation: By monitoring velocity, project managers can allocate resources effectively to ensure that tasks are completed on time.
- Delay Identification: Velocity helps in identifying delays early on, allowing project managers to take corrective action to prevent further issues.
4.3. Marketing
In marketing, velocity can be used to measure the speed at which campaigns are launched and results are achieved. This helps in optimizing marketing strategies, managing resources, and improving overall performance.
- Campaign Launch Speed: Velocity can be used to measure the speed at which marketing campaigns are launched.
- Result Tracking: By monitoring velocity, marketers can track the results of their campaigns and make adjustments as needed.
- Resource Management: Velocity helps in allocating resources effectively to ensure that marketing goals are achieved.
4.4. Healthcare
In healthcare, velocity can be used to measure the speed at which patients are treated and discharged. This helps in optimizing workflows, managing resources, and improving patient outcomes.
- Patient Throughput: Velocity can be used to measure the speed at which patients are treated and discharged.
- Resource Optimization: By monitoring velocity, healthcare providers can optimize resource allocation to ensure that patients receive timely care.
- Outcome Improvement: Velocity helps in improving patient outcomes by ensuring that they receive the care they need in a timely manner.
5. Case Studies: Successful Implementation of Velocity Tracking
Examining case studies where velocity tracking has been successfully implemented can provide valuable insights into its practical benefits and how it can be applied in different scenarios.
5.1. Case Study 1: Software Development Company
A software development company implemented velocity tracking to improve its sprint planning and resource allocation. By tracking velocity over multiple sprints, the company was able to accurately estimate the amount of work a team could complete in a sprint. This resulted in more realistic timelines, improved resource allocation, and better overall project management.
- Challenge: The company was struggling with unrealistic timelines and poor resource allocation, leading to frequent project delays.
- Solution: The company implemented velocity tracking to accurately estimate the amount of work a team could complete in a sprint.
- Results: The company achieved more realistic timelines, improved resource allocation, and better overall project management.
5.2. Case Study 2: Construction Firm
A construction firm implemented velocity tracking to monitor the progress of its projects and identify potential delays. By tracking velocity, the firm was able to identify issues early on and take corrective action to prevent further problems. This resulted in projects being completed on time and within budget.
- Challenge: The construction firm was facing frequent delays and cost overruns due to poor project management.
- Solution: The firm implemented velocity tracking to monitor the progress of its projects and identify potential delays.
- Results: The firm completed projects on time and within budget, improving its overall efficiency and profitability.
5.3. Case Study 3: Marketing Agency
A marketing agency implemented velocity tracking to measure the speed at which campaigns were launched and results were achieved. By tracking velocity, the agency was able to optimize its marketing strategies and improve overall performance. This resulted in more successful campaigns and increased client satisfaction.
- Challenge: The marketing agency was struggling to launch campaigns quickly and achieve desired results.
- Solution: The agency implemented velocity tracking to measure the speed at which campaigns were launched and results were achieved.
- Results: The agency launched more successful campaigns, increased client satisfaction, and improved its overall performance.
6. Advanced Techniques for Velocity Calculation and Prediction
Beyond the basic calculation of velocity, there are advanced techniques that can be used to improve accuracy and predictability. These techniques involve statistical analysis, consideration of external factors, and the use of predictive models.
6.1. Statistical Analysis of Velocity Data
Statistical analysis can provide deeper insights into velocity data, helping to identify trends, patterns, and anomalies. Techniques such as regression analysis, moving averages, and standard deviation can be used to analyze velocity data and improve predictions.
- Regression Analysis: This technique can be used to identify the relationship between velocity and other factors, such as team size, experience, and project complexity.
- Moving Averages: This technique can be used to smooth out fluctuations in velocity data and identify long-term trends.
- Standard Deviation: This technique can be used to measure the variability of velocity data and identify outliers.
6.2. Incorporating External Factors into Velocity Prediction
External factors, such as team member absences, unexpected bugs, and changes in project scope, can impact velocity. Incorporating these factors into velocity prediction models can improve accuracy and reliability.
- Team Member Absences: Account for planned and unplanned absences when estimating velocity.
- Unexpected Bugs: Factor in the potential for unexpected bugs and their impact on team productivity.
- Project Scope Changes: Adjust velocity estimates to reflect any changes in project scope or requirements.
6.3. Using Predictive Models to Forecast Velocity
Predictive models, such as machine learning algorithms, can be used to forecast velocity based on historical data and external factors. These models can provide more accurate and reliable predictions than traditional methods.
- Machine Learning Algorithms: Algorithms such as linear regression, decision trees, and neural networks can be used to predict velocity based on historical data.
- Training Data: Train predictive models using historical velocity data and external factors to improve accuracy.
- Validation: Validate predictive models using real-world data to ensure they are reliable and accurate.
7. The Role of Team Dynamics and Culture in Velocity
Team dynamics and culture play a significant role in velocity. A collaborative, supportive, and motivated team is more likely to achieve higher velocity than a team that is dysfunctional or disengaged.
7.1. Fostering Collaboration and Communication
Collaboration and communication are essential for a high-performing team. Encouraging team members to work together, share ideas, and communicate openly can improve velocity and overall project success.
- Team Building Activities: Organize team building activities to foster camaraderie and improve communication.
- Regular Meetings: Conduct regular meetings to discuss progress, challenges, and ideas.
- Open Communication Channels: Establish open communication channels, such as instant messaging and email, to facilitate communication.
7.2. Creating a Supportive and Positive Work Environment
A supportive and positive work environment can boost team morale and motivation, leading to higher velocity. Recognizing and rewarding team members for their contributions can create a sense of appreciation and encourage them to perform at their best.
- Recognition Programs: Implement recognition programs to reward team members for their achievements.
- Positive Feedback: Provide positive feedback and encouragement to boost team morale.
- Work-Life Balance: Support work-life balance to prevent burnout and maintain team motivation.
7.3. Promoting Continuous Learning and Improvement
Promoting continuous learning and improvement can help team members develop new skills and improve their performance. Providing opportunities for training, attending conferences, and sharing knowledge can enhance team capabilities and velocity.
- Training Programs: Offer training programs to help team members develop new skills.
- Conference Attendance: Encourage team members to attend conferences and workshops to stay up-to-date on industry trends.
- Knowledge Sharing: Foster a culture of knowledge sharing where team members can learn from each other.
8. Integrating Velocity with Other Agile Metrics
Velocity is just one of many agile metrics that can be used to measure team performance and project progress. Integrating velocity with other metrics, such as burndown charts, cycle time, and lead time, can provide a more comprehensive view of project performance.
8.1. Using Burndown Charts to Visualize Sprint Progress
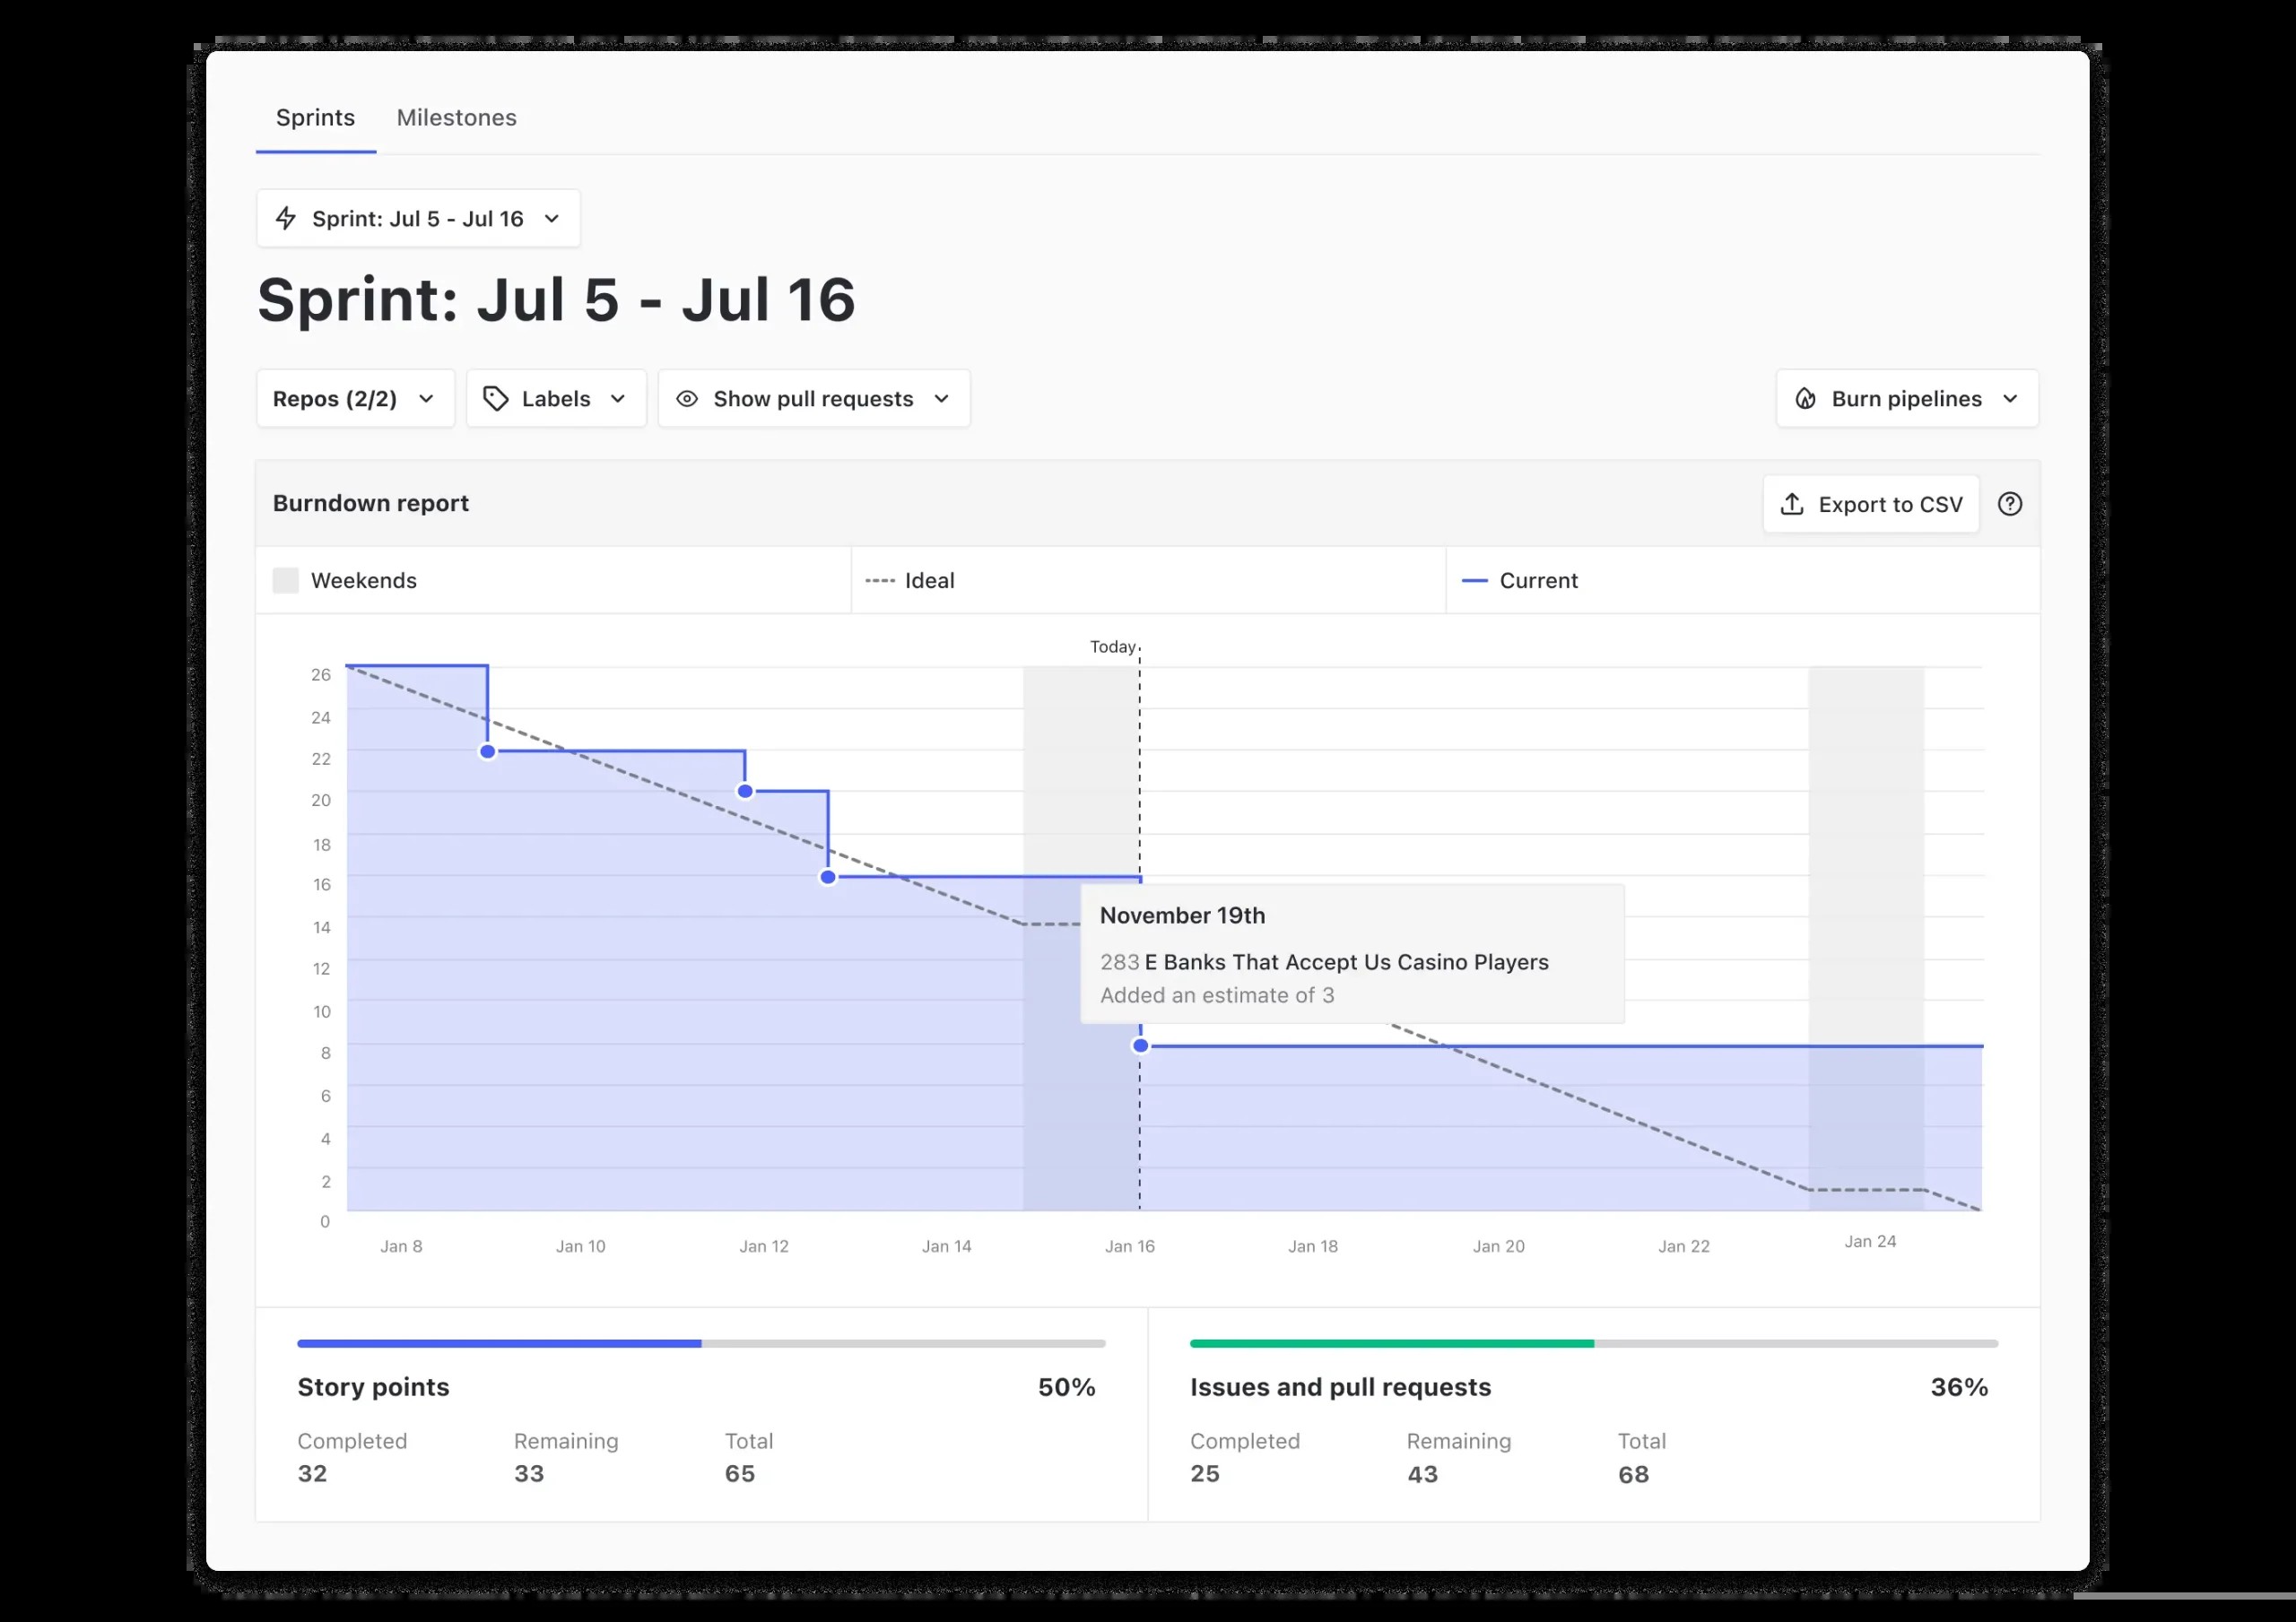
Burndown charts provide a visual representation of the work remaining in a sprint. By tracking the amount of work completed each day, teams can monitor their progress and identify potential issues.
- Daily Tracking: Update burndown charts daily to track progress and identify any deviations from the plan.
- Trend Analysis: Analyze burndown charts to identify trends and patterns in sprint progress.
- Issue Identification: Use burndown charts to identify potential issues, such as scope creep or resource constraints.
8.2. Measuring Cycle Time and Lead Time to Identify Bottlenecks
Cycle time measures the time it takes to complete a task from start to finish, while lead time measures the time it takes to deliver a feature to the customer. By measuring these metrics, teams can identify bottlenecks and improve their overall efficiency.
- Cycle Time Analysis: Analyze cycle time data to identify tasks that take longer to complete and address any underlying issues.
- Lead Time Optimization: Optimize lead time by streamlining processes and eliminating unnecessary steps.
- Bottleneck Identification: Use cycle time and lead time data to identify bottlenecks in the workflow and implement solutions to improve efficiency.
8.3. Balancing Velocity with Quality and Customer Satisfaction
While increasing velocity is important, it should not come at the expense of quality and customer satisfaction. Balancing velocity with these other factors is essential for long-term project success.
- Quality Assurance: Implement rigorous quality assurance processes to ensure that features are delivered without defects.
- Customer Feedback: Collect customer feedback regularly to ensure that the product meets their needs and expectations.
- Continuous Improvement: Continuously improve processes to balance velocity, quality, and customer satisfaction.
9. The Future of Velocity: Emerging Trends and Technologies
The future of velocity is likely to be shaped by emerging trends and technologies, such as artificial intelligence, machine learning, and advanced analytics. These technologies have the potential to improve the accuracy and predictability of velocity, enabling teams to make more informed decisions and improve their overall performance.
9.1. Artificial Intelligence and Machine Learning in Velocity Prediction
Artificial intelligence and machine learning can be used to analyze vast amounts of data and identify patterns that are not apparent to humans. This can improve the accuracy of velocity prediction and enable teams to make more informed decisions.
- Data Analysis: AI and machine learning algorithms can analyze historical data to identify factors that influence velocity.
- Pattern Recognition: These technologies can recognize patterns and trends in velocity data that can be used to improve predictions.
- Predictive Modeling: AI and machine learning can be used to build predictive models that forecast velocity based on historical data and external factors.
9.2. Advanced Analytics for Real-Time Velocity Monitoring
Advanced analytics can provide real-time insights into velocity, enabling teams to monitor their progress and identify potential issues. This can help teams take corrective action quickly and prevent delays.
- Real-Time Data: Advanced analytics tools can provide real-time data on velocity and other agile metrics.
- Dashboards: These tools can create dashboards that visualize velocity data and provide insights into team performance.
- Alerts: Advanced analytics tools can send alerts when velocity deviates from expected levels, enabling teams to take corrective action quickly.
9.3. The Impact of Remote Work on Velocity Measurement
The rise of remote work has had a significant impact on velocity measurement. Remote teams may face challenges such as communication barriers, lack of face-to-face interaction, and differences in time zones. However, these challenges can be overcome by implementing effective communication strategies, using collaboration tools, and establishing clear expectations.
- Communication Strategies: Implement effective communication strategies, such as regular video conferences and instant messaging, to facilitate communication among remote team members.
- Collaboration Tools: Use collaboration tools, such as project management software and document sharing platforms, to enable remote team members to work together effectively.
- Clear Expectations: Establish clear expectations for remote team members to ensure that they are aligned on goals and responsibilities.
10. Frequently Asked Questions (FAQs) About How to Calculate Velocity
Here are some frequently asked questions about calculating velocity to help you better understand and implement this valuable metric.
10.1. What is the difference between velocity and capacity?
Velocity measures the amount of work a team can complete in a sprint, while capacity measures the amount of time and resources available to the team. Velocity is typically measured in story points, while capacity is measured in hours or days.
10.2. How many sprints should I use to calculate velocity?
It is generally recommended to use at least three to five sprints to calculate velocity. This provides a more accurate and reliable estimate of the team’s capacity.
10.3. How do I handle incomplete user stories when calculating velocity?
Incomplete user stories should not be included in the velocity calculation for the current sprint. Instead, they should be carried over to the next sprint and included in the velocity calculation when they are completed.
10.4. What factors can affect velocity?
Several factors can affect velocity, including team size, experience, skill set, project complexity, external factors, and team dynamics.
10.5. How can I improve my team’s velocity?
You can improve your team’s velocity by enhancing visibility, conducting high-impact daily scrum meetings, emphasizing the importance of retrospectives, and focusing on system bottlenecks over individuals.
10.6. Should velocity be used to compare teams?
No, velocity should not be used to compare teams. Each team has its own unique dynamics, skill sets, and project complexities. Comparing velocity across teams can be misleading and counterproductive.
10.7. How often should I recalculate velocity?
You should recalculate velocity after each sprint to ensure that it remains accurate and up-to-date. This allows you to track changes in team performance and adjust your estimates accordingly.
10.8. What tools can I use to track velocity?
Several tools can be used to track velocity, including Jira, Zenhub, Trello, Asana, and Azure DevOps. These tools provide features for tracking story points, sprint progress, and team performance.
10.9. How do I estimate story points?
Story points are estimated using relative estimation techniques, such as planning poker. Team members discuss the complexity, effort, and risk associated with each user story and assign a story point value based on their collective understanding.
10.10. What is the ideal velocity for a team?
There is no ideal velocity for a team. The appropriate velocity depends on the team’s size, skill set, project complexity, and other factors. The goal is to establish a consistent and reliable velocity that can be used for sprint planning and project estimation.
Are you facing challenges in accurately calculating velocity or optimizing your team’s performance? At HOW.EDU.VN, we connect you with leading PhDs and experts who can provide personalized guidance and solutions. Don’t let estimation challenges hold you back—contact us today to boost your project’s success. Reach out to us at 456 Expertise Plaza, Consult City, CA 90210, United States, or via WhatsApp at +1 (310) 555-1212. Visit our website at how.edu.vn for more information and to schedule a consultation.