The legal profession is often viewed as a lucrative career path, but the reality is that lawyer salaries can vary significantly. According to the Bureau of Labor Statistics, the national average annual wage for lawyers is $135,740. The job market for lawyers is projected to grow 8% from 2022 to 2032, which is faster than average compared to all other occupations. But how much does a lawyer make depending on location? Let’s break down the specifics.
Lawyer Salary by State: A Wide Range
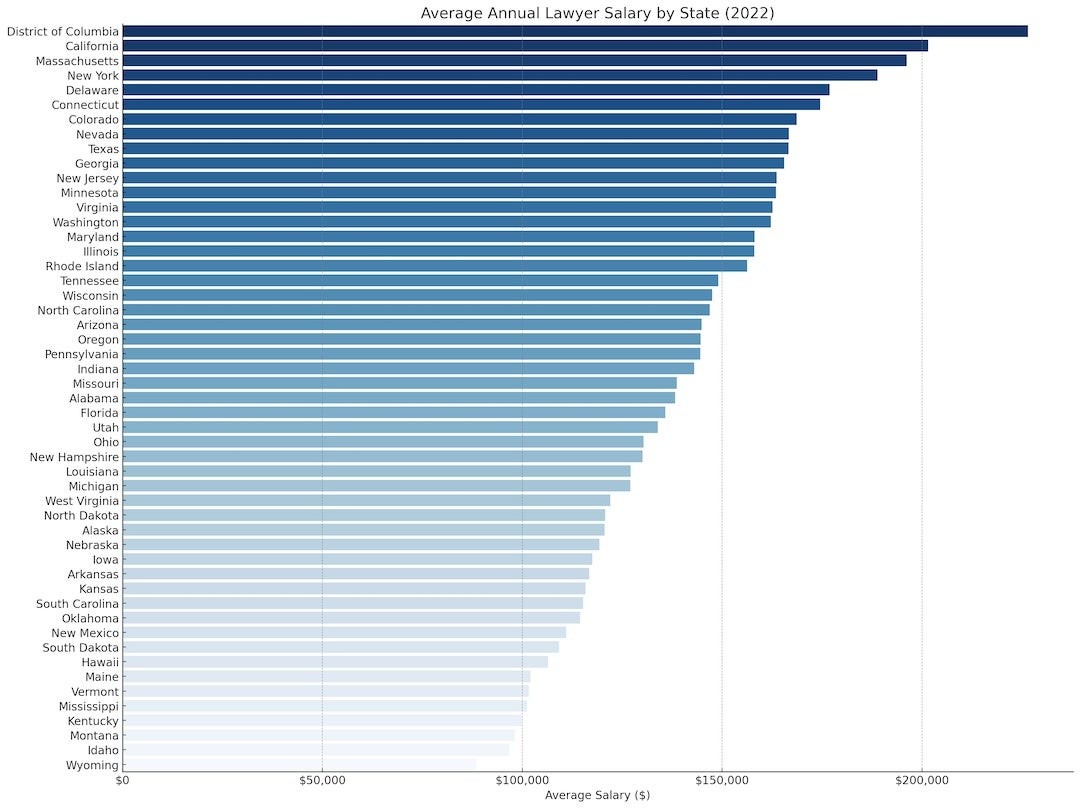
It’s crucial to understand that lawyer salaries aren’t uniform across the United States. The state where a lawyer practices law can significantly impact their earning potential. For instance, California, the highest-paying state, boasts an average lawyer salary of $201,530. However, in Wyoming, the lowest-paying state, the average salary is around $88,570. This amounts to more than a $110,000 difference. The District of Columbia leads the nation with an average annual salary of $226,510 for lawyers.
Top and Bottom Paying States for Lawyers
Here’s a breakdown of the five highest and five lowest paying states for lawyers as of 2022:
Five Highest Paying States:
- California ($201,530)
- Massachusetts ($196,230)
- New York ($188,900)
- Delaware ($176,904)
- Connecticut ($174,520)
Five Lowest Paying States:
- Wyoming ($88,570)
- Idaho ($96,810)
- Montana ($98,170)
- Kentucky ($99,840)
- Mississippi ($101,240)
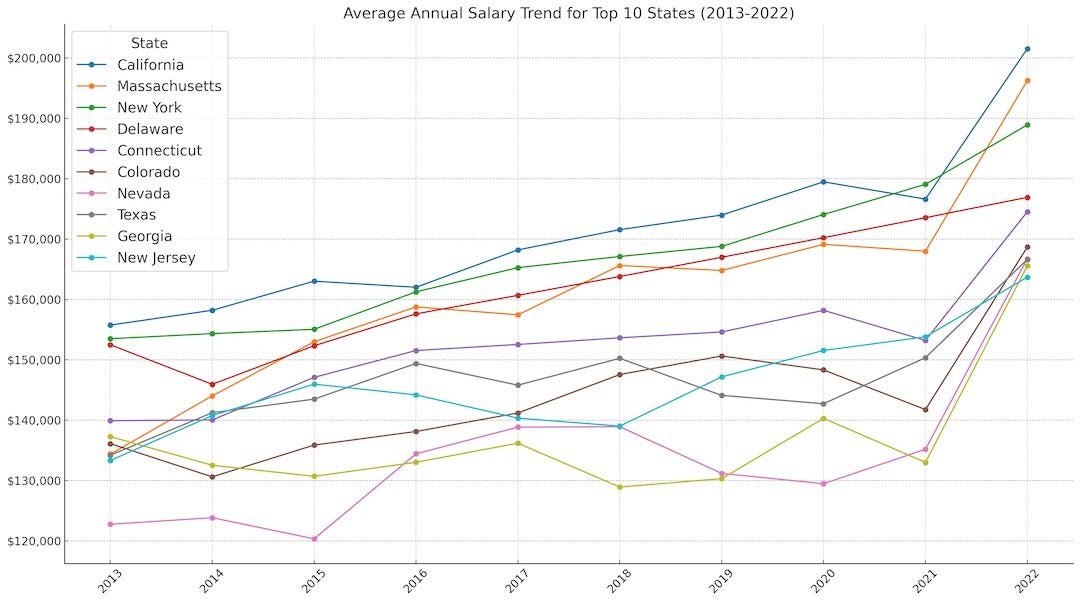
Salary Growth Trends Over the Last Decade
Analyzing salary trends over time provides valuable insights. The states that witnessed the most significant increase in average lawyer salaries over the past 10 years are:
- Rhode Island (+57.86%)
- Massachusetts (+46.03%)
- Indiana (+44.17%)
- Wisconsin (+40.40%)
- Tennessee (37.70%)
These figures suggest that certain regions are experiencing higher demand or a greater cost of living adjustments, impacting lawyer compensation.
Detailed Lawyer Salary Data by State (2013-2022)
| Rank | State | 2022 Avg. Salary | 2021 Avg. Salary | 2020 Avg. Salary | 2019 Avg. Salary | 2018 Avg. Salary | 2017 Avg. Salary | 2016 Avg. Salary | 2015 Avg. Salary | 2014 Avg. Salary | 2013 Avg. Salary | 5-Year Change | 10-Year Change |
|---|---|---|---|---|---|---|---|---|---|---|---|---|---|
| 1 | California | $201,530 | $176,610 | $179,470 | $173,970 | $171,550 | $168,200 | $162,010 | $163,020 | $158,200 | $155,750 | 19.82% | 29.39% |
| 2 | Massachusetts | $196,230 | $167,980 | $169,120 | $164,800 | $165,610 | $157,450 | $158,760 | $152,990 | $144,030 | $134,380 | 24.63% | 46.03% |
| 3 | New York | $188,900 | $179,060 | $174,060 | $168,780 | $167,110 | $165,260 | $161,260 | $155,050 | $154,340 | $153,490 | 14.30% | 23.07% |
| 4 | Delaware | $176,904 | $173,531 | $170,223 | $166,978 | $163,795 | $160,673 | $157,610 | $152,330 | $145,940 | $152,490 | 0.00% | 0.00% |
| 5 | Connecticut | $174,520 | $153,200 | $158,190 | $154,610 | $153,640 | $152,540 | $151,540 | $147,100 | $140,040 | $139,920 | 14.41% | 24.73% |
| 6 | Colorado | $168,680 | $141,760 | $148,330 | $150,630 | $147,560 | $141,200 | $138,130 | $135,880 | $130,620 | $136,120 | 19.46% | 23.92% |
| 7 | Nevada | $166,740 | $135,200 | $129,480 | $131,190 | $138,920 | $138,850 | $134,440 | $120,360 | $123,850 | $122,770 | 20.09% | 35.81% |
| 8 | Texas | $166,620 | $150,350 | $142,730 | $144,110 | $150,250 | $145,800 | $149,400 | $143,490 | $141,240 | $134,200 | 14.28% | 24.16% |
| 9 | Georgia | $165,560 | $133,020 | $140,300 | $130,320 | $128,930 | $136,190 | $133,030 | $130,710 | $132,540 | $137,280 | 21.57% | 20.60% |
| 10 | New Jersey | $163,690 | $153,800 | $151,550 | $147,170 | $139,020 | $140,340 | $144,190 | $145,970 | $140,770 | $133,330 | 16.64% | 22.77% |
| 11 | Minnesota | $163,480 | $133,750 | $131,460 | $124,510 | $119,330 | $124,230 | $133,390 | $128,320 | $128,290 | $126,520 | 31.59% | 29.21% |
| 12 | Virginia | $162,640 | $146,140 | $151,970 | $143,220 | $139,180 | $136,790 | $139,050 | $135,180 | $131,320 | $129,800 | 18.90% | 25.30% |
| 13 | Washington | $162,200 | $136,210 | $131,530 | $129,550 | $136,480 | $129,220 | $126,900 | $124,000 | $120,740 | $119,900 | 25.52% | 35.28% |
| 14 | Maryland | $158,150 | $140,450 | $139,610 | $135,500 | $128,340 | $126,480 | $123,220 | $121,530 | $126,060 | $127,040 | 25.04% | 24.49% |
| 15 | Illinois | $158,030 | $148,280 | $153,720 | $157,010 | $152,980 | $140,920 | $129,070 | $125,920 | $124,680 | $132,910 | 12.14% | 18.90% |
| 16 | Rhode Island | $156,300 | $148,770 | $134,370 | $124,600 | $125,330 | $129,410 | $131,430 | $129,100 | $119,010 | $99,010 | 20.78% | 57.86% |
| 17 | Tennessee | $149,050 | $123,180 | $121,790 | $124,370 | $124,470 | $129,830 | $127,700 | $125,530 | $113,580 | $108,240 | 14.80% | 37.70% |
| 18 | Wisconsin | $147,530 | $131,630 | $124,410 | $129,440 | $130,450 | $123,600 | $111,080 | $101,990 | $101,980 | $105,080 | 19.36% | 40.40% |
| 19 | North Carolina | $146,890 | $131,960 | $132,190 | $133,290 | $129,990 | $137,200 | $138,470 | $123,940 | $118,310 | $114,840 | 7.06% | 27.91% |
| 20 | Arizona | $144,890 | $126,600 | $140,520 | $136,170 | $145,750 | $138,680 | $130,630 | $125,660 | $117,380 | $131,200 | 4.48% | 10.43% |
| 21 | Oregon | $144,610 | $139,520 | $128,160 | $116,860 | $119,500 | $117,810 | $114,730 | $117,800 | $114,870 | $111,640 | 22.75% | 29.53% |
| 22 | Pennsylvania | $144,570 | $133,330 | $139,120 | $142,890 | $138,610 | $139,050 | $134,600 | $131,090 | $129,460 | $134,250 | 3.97% | 7.69% |
| 23 | Indiana | $143,060 | $123,370 | $117,820 | $111,790 | $113,360 | $113,850 | $114,270 | $110,240 | $103,010 | $99,230 | 25.66% | 44.17% |
| 24 | Missouri | $138,680 | $126,940 | $111,020 | $109,820 | $113,780 | $115,520 | $116,060 | $114,480 | $121,500 | $116,190 | 20.05% | 19.36% |
| 25 | Alabama | $138,250 | $127,910 | $121,130 | $114,240 | $117,100 | $117,640 | $118,420 | $114,820 | $113,010 | $106,790 | 17.52% | 29.46% |
| 26 | Florida | $135,840 | $129,390 | $139,160 | $130,010 | $128,920 | $127,730 | $131,990 | $128,050 | $122,020 | $123,040 | 6.35% | 10.40% |
| 27 | Utah | $133,920 | $129,090 | $141,460 | $134,770 | $112,380 | $109,280 | $108,670 | $113,550 | $118,910 | $115,930 | 22.55% | 15.52% |
| 28 | Ohio | $130,320 | $122,550 | $128,170 | $124,160 | $121,520 | $113,610 | $113,400 | $113,360 | $113,200 | $108,950 | 14.71% | 19.61% |
| 29 | New Hampshire | $130,130 | $124,230 | $129,590 | $126,220 | $125,890 | $119,650 | $115,410 | $114,470 | $111,050 | $112,710 | 8.76% | 15.46% |
| 30 | Louisiana | $127,150 | $110,340 | $112,190 | $108,070 | $105,490 | $101,170 | $105,740 | $111,240 | $113,830 | $110,760 | 25.68% | 14.80% |
| 31 | Michigan | $127,030 | $121,780 | $119,150 | $116,310 | $110,180 | $112,740 | $110,760 | $110,920 | $116,710 | $114,460 | 12.68% | 10.98% |
| 32 | West Virginia | $122,070 | $107,380 | $109,290 | $102,040 | $98,630 | $95,220 | $100,430 | $98,270 | $94,010 | $90,240 | 28.20% | 35.27% |
| 33 | North Dakota | $120,780 | $107,190 | $113,480 | $113,280 | $107,290 | $97,680 | $102,660 | $101,840 | * | $90,850 | 23.65% | 32.94% |
| 34 | Alaska | $120,590 | $113,910 | $116,440 | $115,260 | $121,680 | $122,870 | $123,770 | $121,910 | $117,910 | $120,500 | -1.86% | 0.07% |
| 35 | Nebraska | $119,310 | $106,560 | $118,070 | $112,860 | $108,170 | $110,950 | $107,590 | $106,460 | $93,820 | $95,220 | 7.53% | 25.30% |
| 36 | Iowa | $117,500 | $117,580 | $122,400 | $119,700 | $112,630 | $113,470 | $108,660 | $106,820 | $106,080 | $106,920 | 3.55% | 9.90% |
| 37 | Arkansas | $116,730 | $107,750 | $94,800 | $94,000 | $98,780 | $99,100 | $103,980 | $100,320 | $100,690 | $101,340 | 17.79% | 15.19% |
| 38 | Kansas | $115,860 | $102,640 | $117,910 | $110,290 | $109,020 | $104,730 | $106,470 | $105,790 | $98,850 | $98,750 | 10.63% | 17.33% |
| 39 | South Carolina | $115,230 | $107,780 | $114,320 | $111,090 | $105,320 | $104,300 | $107,230 | $109,250 | $113,760 | $108,790 | 10.48% | 5.92% |
| 40 | Oklahoma | $114,470 | $105,370 | $122,040 | $116,270 | $118,790 | $115,260 | $123,510 | $116,900 | $112,520 | $101,310 | -0.69% | 12.99% |
| 41 | New Mexico | $110,970 | $116,220 | $107,700 | $103,290 | $105,910 | $99,510 | $97,100 | $91,430 | $96,520 | $98,150 | 11.52% | 13.06% |
| 42 | South Dakota | $109,190 | $100,100 | $111,930 | $112,810 | $109,070 | $100,000 | $101,360 | $96,580 | $98,360 | $99,650 | 9.19% | 9.57% |
| 43 | Hawaii | $106,520 | $102,090 | $114,520 | $109,420 | $111,290 | $113,190 | $106,650 | $104,180 | $105,410 | $108,820 | -5.89% | -2.11% |
| 44 | Maine | $102,060 | $100,890 | $98,980 | $106,350 | $107,120 | $102,040 | $106,270 | $99,260 | $100,720 | $93,940 | 0.02% | 8.64% |
| 45 | Vermont | $101,610 | $94,810 | $100,950 | $104,790 | $107,490 | $105,900 | $103,970 | $106,610 | $101,620 | $98,580 | -4.05% | 3.07% |
| 46 | Mississippi | $101,240 | $97,440 | $93,380 | $95,040 | $97,990 | $106,360 | $114,710 | $103,180 | $99,470 | $92,640 | -4.81% | 9.28% |
| 47 | Kentucky | $99,840 | $96,940 | $105,130 | $102,980 | $100,100 | $95,890 | $93,020 | $93,560 | $92,090 | $90,200 | 4.12% | 10.69% |
| 48 | Montana | $98,170 | $96,200 | $93,220 | $83,030 | $88,600 | $83,150 | $83,330 | $82,070 | $75,720 | $75,360 | 18.06% | 30.27% |
| 49 | Idaho | $96,810 | $99,740 | $108,470 | $105,450 | $99,360 | $98,390 | $91,390 | $96,900 | $100,900 | $105,380 | -1.61% | -8.13% |
| 50 | Wyoming | $88,570 | $92,410 | $102,810 | $100,090 | $105,600 | $98,090 | $112,710 | $102,130 | $103,290 | $89,280 | -9.71% | -0.80% |
Factors Influencing a Lawyer’s Salary
Several factors determine how much a lawyer makes:
- Location: As demonstrated above, location is a primary driver of salary differences.
- Experience: Entry-level lawyers typically earn less than seasoned attorneys with years of experience.
- Specialization: Certain legal specializations, such as corporate law or intellectual property law, often command higher salaries.
- Type of Employer: Lawyers working in large law firms tend to earn more than those in smaller firms, government positions, or non-profit organizations.
- Education and Credentials: Graduating from a top-tier law school and having a strong academic record can positively influence earning potential.
Conclusion
Understanding “how much does a lawyer make” involves considering various factors, with location playing a significant role. The data reveals substantial differences in average lawyer salaries across states, highlighting the importance of geographic location in determining earning potential in the legal profession. While the national average provides a benchmark, aspiring and practicing lawyers should research specific state and local market conditions to gain a more accurate understanding of potential earnings.
Source: Occupational Outlook Handbook published by the Bureau of Labor Statistics.