The legal profession is often associated with prestige and financial reward. But how much money do lawyers make, really? While the Bureau of Labor Statistics (BLS) reports a national average annual wage of $135,740 for lawyers, the reality is far more nuanced. Factors such as location, experience, specialization, and type of employer significantly impact earning potential. This article breaks down lawyer salaries across the United States, revealing the states where lawyers earn the most and least, and highlighting recent salary trends.
According to the BLS, the job market for lawyers is projected to grow by 8% between 2022 and 2032, which is faster than average for all occupations. This positive outlook suggests continued demand for legal professionals, but it’s crucial to understand the geographic disparities in compensation.
Highest and Lowest Paying States for Lawyers
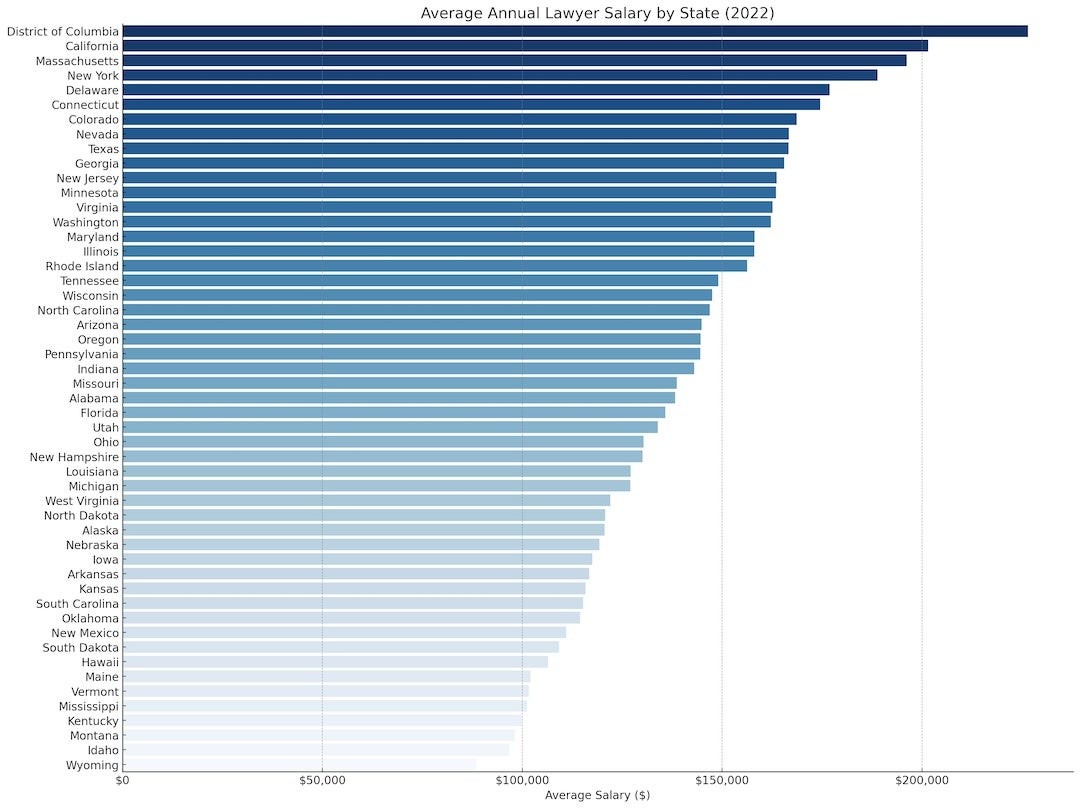
The difference in lawyer salaries between states can be substantial. The District of Columbia tops the list with an average annual salary of $226,510. California comes in second, boasting an average salary of $201,530 for lawyers, which is approximately $110,000 more than what lawyers earn on average in Wyoming.
Here’s a look at the five highest paying states for lawyers:
- District of Columbia ($226,510)
- California ($201,530)
- Massachusetts ($196,230)
- New York ($188,900)
- Delaware ($176,904)
Conversely, these are the five lowest paying states for lawyers:
- Wyoming ($88,570)
- Idaho ($96,810)
- Montana ($98,170)
- Kentucky ($99,840)
- Mississippi ($101,240)
A visual representation of average lawyer salaries across the United States in 2022, showcasing regional disparities.
This significant variation underscores the importance of considering location when evaluating career opportunities in law. The cost of living, demand for legal services, and concentration of high-paying legal sectors all contribute to these differences.
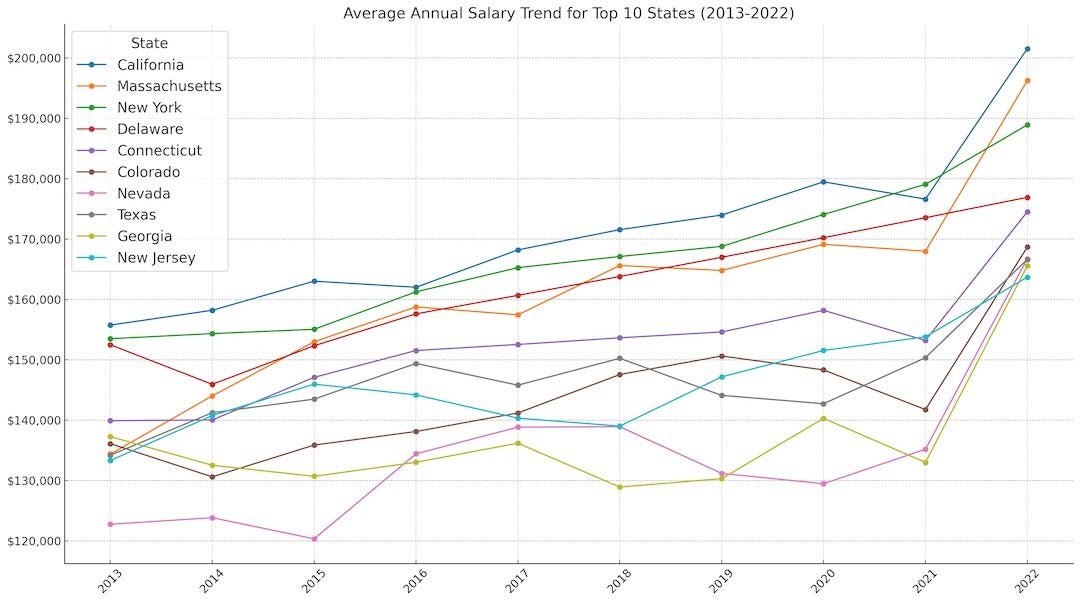
Salary Growth Trends for Lawyers
Analyzing salary trends over time provides valuable insights into the evolving legal landscape. Some states have experienced remarkable growth in lawyer salaries over the past decade.
The states with the most significant increases in average lawyer salary over the last 10 years include:
- Rhode Island (+57.86%)
- Massachusetts (+46.03%)
- Indiana (+44.17%)
- Wisconsin (+40.40%)
- Tennessee (+37.70%)
These figures suggest a dynamic legal market with certain regions experiencing rapid growth and increased demand for legal professionals.
A graph illustrating the average annual salary trends for lawyers in the top 10 highest-paying states from 2013 to 2022.
Detailed State-by-State Lawyer Salary Data
The following table provides a comprehensive overview of lawyer salaries across all states, along with historical data and percentage changes over the past five and ten years. This data can be invaluable for those considering a career in law or looking to relocate for better opportunities.
| Rank | State | 2022 Avg. Salary | 2021 Avg. Salary | 2020 Avg. Salary | 2019 Avg. Salary | 2018 Avg. Salary | 2017 Avg. Salary | 2016 Avg. Salary | 2015 Avg. Salary | 2014 Avg. Salary | 2013 Avg. Salary | 5-Year Change | 10-Year Change |
|---|---|---|---|---|---|---|---|---|---|---|---|---|---|
| 1 | California | $201,530 | $176,610 | $179,470 | $173,970 | $171,550 | $168,200 | $162,010 | $163,020 | $158,200 | $155,750 | 19.82% | 29.39% |
| 2 | Massachusetts | $196,230 | $167,980 | $169,120 | $164,800 | $165,610 | $157,450 | $158,760 | $152,990 | $144,030 | $134,380 | 24.63% | 46.03% |
| 3 | New York | $188,900 | $179,060 | $174,060 | $168,780 | $167,110 | $165,260 | $161,260 | $155,050 | $154,340 | $153,490 | 14.30% | 23.07% |
| 4 | Delaware | $176,904 | $173,531 | $170,223 | $166,978 | $163,795 | $160,673 | $157,610 | $152,330 | $145,940 | $152,490 | 0.00% | 0.00% |
| 5 | Connecticut | $174,520 | $153,200 | $158,190 | $154,610 | $153,640 | $152,540 | $151,540 | $147,100 | $140,040 | $139,920 | 14.41% | 24.73% |
| 6 | Colorado | $168,680 | $141,760 | $148,330 | $150,630 | $147,560 | $141,200 | $138,130 | $135,880 | $130,620 | $136,120 | 19.46% | 23.92% |
| 7 | Nevada | $166,740 | $135,200 | $129,480 | $131,190 | $138,920 | $138,850 | $134,440 | $120,360 | $123,850 | $122,770 | 20.09% | 35.81% |
| 8 | Texas | $166,620 | $150,350 | $142,730 | $144,110 | $150,250 | $145,800 | $149,400 | $143,490 | $141,240 | $134,200 | 14.28% | 24.16% |
| 9 | Georgia | $165,560 | $133,020 | $140,300 | $130,320 | $128,930 | $136,190 | $133,030 | $130,710 | $132,540 | $137,280 | 21.57% | 20.60% |
| 10 | New Jersey | $163,690 | $153,800 | $151,550 | $147,170 | $139,020 | $140,340 | $144,190 | $145,970 | $140,770 | $133,330 | 16.64% | 22.77% |
| 11 | Minnesota | $163,480 | $133,750 | $131,460 | $124,510 | $119,330 | $124,230 | $133,390 | $128,320 | $128,290 | $126,520 | 31.59% | 29.21% |
| 12 | Virginia | $162,640 | $146,140 | $151,970 | $143,220 | $139,180 | $136,790 | $139,050 | $135,180 | $131,320 | $129,800 | 18.90% | 25.30% |
| 13 | Washington | $162,200 | $136,210 | $131,530 | $129,550 | $136,480 | $129,220 | $126,900 | $124,000 | $120,740 | $119,900 | 25.52% | 35.28% |
| 14 | Maryland | $158,150 | $140,450 | $139,610 | $135,500 | $128,340 | $126,480 | $123,220 | $121,530 | $126,060 | $127,040 | 25.04% | 24.49% |
| 15 | Illinois | $158,030 | $148,280 | $153,720 | $157,010 | $152,980 | $140,920 | $129,070 | $125,920 | $124,680 | $132,910 | 12.14% | 18.90% |
| 16 | Rhode Island | $156,300 | $148,770 | $134,370 | $124,600 | $125,330 | $129,410 | $131,430 | $129,100 | $119,010 | $99,010 | 20.78% | 57.86% |
| 17 | Tennessee | $149,050 | $123,180 | $121,790 | $124,370 | $124,470 | $129,830 | $127,700 | $125,530 | $113,580 | $108,240 | 14.80% | 37.70% |
| 18 | Wisconsin | $147,530 | $131,630 | $124,410 | $129,440 | $130,450 | $123,600 | $111,080 | $101,990 | $101,980 | $105,080 | 19.36% | 40.40% |
| 19 | North Carolina | $146,890 | $131,960 | $132,190 | $133,290 | $129,990 | $137,200 | $138,470 | $123,940 | $118,310 | $114,840 | 7.06% | 27.91% |
| 20 | Arizona | $144,890 | $126,600 | $140,520 | $136,170 | $145,750 | $138,680 | $130,630 | $125,660 | $117,380 | $131,200 | 4.48% | 10.43% |
| 21 | Oregon | $144,610 | $139,520 | $128,160 | $116,860 | $119,500 | $117,810 | $114,730 | $117,800 | $114,870 | $111,640 | 22.75% | 29.53% |
| 22 | Pennsylvania | $144,570 | $133,330 | $139,120 | $142,890 | $138,610 | $139,050 | $134,600 | $131,090 | $129,460 | $134,250 | 3.97% | 7.69% |
| 23 | Indiana | $143,060 | $123,370 | $117,820 | $111,790 | $113,360 | $113,850 | $114,270 | $110,240 | $103,010 | $99,230 | 25.66% | 44.17% |
| 24 | Missouri | $138,680 | $126,940 | $111,020 | $109,820 | $113,780 | $115,520 | $116,060 | $114,480 | $121,500 | $116,190 | 20.05% | 19.36% |
| 25 | Alabama | $138,250 | $127,910 | $121,130 | $114,240 | $117,100 | $117,640 | $118,420 | $114,820 | $113,010 | $106,790 | 17.52% | 29.46% |
| 26 | Florida | $135,840 | $129,390 | $139,160 | $130,010 | $128,920 | $127,730 | $131,990 | $128,050 | $122,020 | $123,040 | 6.35% | 10.40% |
| 27 | Utah | $133,920 | $129,090 | $141,460 | $134,770 | $112,380 | $109,280 | $108,670 | $113,550 | $118,910 | $115,930 | 22.55% | 15.52% |
| 28 | Ohio | $130,320 | $122,550 | $128,170 | $124,160 | $121,520 | $113,610 | $113,400 | $113,360 | $113,200 | $108,950 | 14.71% | 19.61% |
| 29 | New Hampshire | $130,130 | $124,230 | $129,590 | $126,220 | $125,890 | $119,650 | $115,410 | $114,470 | $111,050 | $112,710 | 8.76% | 15.46% |
| 30 | Louisiana | $127,150 | $110,340 | $112,190 | $108,070 | $105,490 | $101,170 | $105,740 | $111,240 | $113,830 | $110,760 | 25.68% | 14.80% |
| 31 | Michigan | $127,030 | $121,780 | $119,150 | $116,310 | $110,180 | $112,740 | $110,760 | $110,920 | $116,710 | $114,460 | 12.68% | 10.98% |
| 32 | West Virginia | $122,070 | $107,380 | $109,290 | $102,040 | $98,630 | $95,220 | $100,430 | $98,270 | $94,010 | $90,240 | 28.20% | 35.27% |
| 33 | North Dakota | $120,780 | $107,190 | $113,480 | $113,280 | $107,290 | $97,680 | $102,660 | $101,840 | * | $90,850 | 23.65% | 32.94% |
| 34 | Alaska | $120,590 | $113,910 | $116,440 | $115,260 | $121,680 | $122,870 | $123,770 | $121,910 | $117,910 | $120,500 | -1.86% | 0.07% |
| 35 | Nebraska | $119,310 | $106,560 | $118,070 | $112,860 | $108,170 | $110,950 | $107,590 | $106,460 | $93,820 | $95,220 | 7.53% | 25.30% |
| 36 | Iowa | $117,500 | $117,580 | $122,400 | $119,700 | $112,630 | $113,470 | $108,660 | $106,820 | $106,080 | $106,920 | 3.55% | 9.90% |
| 37 | Arkansas | $116,730 | $107,750 | $94,800 | $94,000 | $98,780 | $99,100 | $103,980 | $100,320 | $100,690 | $101,340 | 17.79% | 15.19% |
| 38 | Kansas | $115,860 | $102,640 | $117,910 | $110,290 | $109,020 | $104,730 | $106,470 | $105,790 | $98,850 | $98,750 | 10.63% | 17.33% |
| 39 | South Carolina | $115,230 | $107,780 | $114,320 | $111,090 | $105,320 | $104,300 | $107,230 | $109,250 | $113,760 | $108,790 | 10.48% | 5.92% |
| 40 | Oklahoma | $114,470 | $105,370 | $122,040 | $116,270 | $118,790 | $115,260 | $123,510 | $116,900 | $112,520 | $101,310 | -0.69% | 12.99% |
| 41 | New Mexico | $110,970 | $116,220 | $107,700 | $103,290 | $105,910 | $99,510 | $97,100 | $91,430 | $96,520 | $98,150 | 11.52% | 13.06% |
| 42 | South Dakota | $109,190 | $100,100 | $111,930 | $112,810 | $109,070 | $100,000 | $101,360 | $96,580 | $98,360 | $99,650 | 9.19% | 9.57% |
| 43 | Hawaii | $106,520 | $102,090 | $114,520 | $109,420 | $111,290 | $113,190 | $106,650 | $104,180 | $105,410 | $108,820 | -5.89% | -2.11% |
| 44 | Maine | $102,060 | $100,890 | $98,980 | $106,350 | $107,120 | $102,040 | $106,270 | $99,260 | $100,720 | $93,940 | 0.02% | 8.64% |
| 45 | Vermont | $101,610 | $94,810 | $100,950 | $104,790 | $107,490 | $105,900 | $103,970 | $106,610 | $101,620 | $98,580 | -4.05% | 3.07% |
| 46 | Mississippi | $101,240 | $97,440 | $93,380 | $95,040 | $97,990 | $106,360 | $114,710 | $103,180 | $99,470 | $92,640 | -4.81% | 9.28% |
| 47 | Kentucky | $99,840 | $96,940 | $105,130 | $102,980 | $100,100 | $95,890 | $93,020 | $93,560 | $92,090 | $90,200 | 4.12% | 10.69% |
| 48 | Montana | $98,170 | $96,200 | $93,220 | $83,030 | $88,600 | $83,150 | $83,330 | $82,070 | $75,720 | $75,360 | 18.06% | 30.27% |
| 49 | Idaho | $96,810 | $99,740 | $108,470 | $105,450 | $99,360 | $98,390 | $91,390 | $96,900 | $100,900 | $105,380 | -1.61% | -8.13% |
| 50 | Wyoming | $88,570 | $92,410 | $102,810 | $100,090 | $105,600 | $98,090 | $112,710 | $102,130 | $103,290 | $89,280 | -9.71% | -0.80% |
Conclusion: Factors Influencing Lawyer Salaries
Determining how much money do lawyers make requires a multifaceted approach. While the national average provides a baseline, understanding the significant impact of location, experience, and specialization is essential. This state-by-state breakdown offers valuable insights for aspiring and current legal professionals seeking to maximize their earning potential. Remember to consider the cost of living and job market dynamics when evaluating these figures.
For more in-depth salary data and insights per legal role, explore resources like Legal.io’s Salary Insights.
Source: Occupational Outlook Handbook published by the Bureau of Labor Statistics.