Unlock expert insights on uranium resources with HOW.EDU.VN. Discover uranium’s presence, availability, and potential for nuclear energy in this detailed analysis. Explore the expertise of our leading PhDs today.
1. Introduction: Uranium’s Abundance and Significance
How Much Uranium Is On Earth? Uranium, an element vital for nuclear power, exists more abundantly than many realize. Understanding its distribution and availability is crucial for assessing its potential role in future energy solutions. At HOW.EDU.VN, we provide expert insights into the world’s uranium resources, offering comprehensive analysis and strategic guidance. Explore uranium deposits, uranium extraction, and nuclear fuel.
2. The Prevalence of Uranium in the Earth’s Crust
Uranium is a relatively common element found throughout the Earth’s crust. Its concentration varies depending on the type of rock, but it’s generally more abundant than elements like tin or zinc. This widespread presence makes it accessible, though economically viable extraction depends on concentration levels and extraction costs.
2.1. Uranium Concentrations in Various Materials
The concentration of uranium varies significantly across different materials. High-grade ores, such as those found in Canada, can contain up to 20% uranium, while low-grade ores might have only 0.1%. Common rocks like granite contain uranium in the range of 3-5 parts per million (ppm), while seawater contains about 0.003 ppm. The following table illustrates typical natural uranium concentrations:
| Material | Uranium Concentration (ppm) |
|---|---|
| Very High-Grade Ore (Canada) | 200,000 |
| High-Grade Ore | 20,000 |
| Low-Grade Ore | 1,000 |
| Very Low-Grade Ore (Namibia) | 100 |
| Granite | 3-5 |
| Sedimentary Rock | 2-3 |
| Earth’s Continental Crust (Avg) | 2.8 |
| Seawater | 0.003 |

This table provides a comprehensive overview of uranium concentrations in different materials, highlighting the wide range of its occurrence.
2.2. Economic Viability of Uranium Extraction
While uranium is present in many materials, the economic viability of its extraction depends on several factors. These include the concentration of uranium, the ease of separation, and the market price of uranium. Ores with low uranium concentrations require cost-effective separation methods, such as sulfuric acid or sodium carbonate leaching, to be economically viable. According to a study funded by the US DOE, innovative methods like polymer absorbent strips could potentially reduce the cost of extracting uranium from seawater to $610/kgU.
This image illustrates the different types of uranium ore deposits, highlighting the geological formations where uranium is concentrated and mined.
3. Global Uranium Resources: An Overview
The world’s total uranium resources are vast but not precisely known. The most meaningful measure for long-term security of supply is the known reserves that can be economically mined. These reserves are influenced by extraction costs and market prices, making them dynamic and subject to change.
3.1. Identified Uranium Resources by Country
As of 2021, the identified uranium resources recoverable at a cost of up to $130/kgU totaled 6,078,500 tonnes. Australia holds the largest share, accounting for 28% of the world’s uranium resources. Kazakhstan follows with 13%, and Canada with 10%. The table below shows the distribution of uranium resources by country:
| Country | Uranium Resources (tonnes U) | Percentage of World |
|---|---|---|
| Australia | 1,684,100 | 28% |
| Kazakhstan | 815,200 | 13% |
| Canada | 588,500 | 10% |
| Russia | 480,900 | 8% |
| Namibia | 470,100 | 8% |
| South Africa | 320,900 | 5% |
| Niger | 311,100 | 5% |
| Brazil | 276,800 | 5% |
| China | 223,900 | 4% |
| Mongolia | 144,600 | 2% |
| Uzbekistan | 131,300 | 2% |
| Ukraine | 107,200 | 2% |
| Botswana | 87,200 | 1% |
| USA | 59,400 | 1% |
| Tanzania | 58,200 | 1% |
| Jordan | 52,500 | 1% |
| Other | 266,600 | 5% |
| World Total | 6,078,500 |
These figures are based on data from the OECD NEA & IAEA, reflecting reasonably assured resources plus inferred resources recoverable at the specified cost.
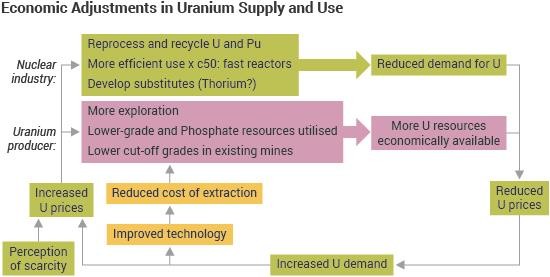
3.2. Factors Influencing Uranium Resource Estimates
Several factors can influence uranium resource estimates. Market prices, extraction costs, and geological knowledge all play a crucial role. Higher uranium prices can make previously uneconomical deposits viable, increasing the total estimated resources. Additionally, advancements in extraction technology can lower costs, further expanding the resource base. Continuous geological exploration also leads to the discovery of new deposits, contributing to the growth of known uranium resources.
This image presents a detailed flow diagram of uranium supply and use, illustrating the various stages from mining to reactor fuel and waste management.
4. Historical Uranium Production: A Retrospective
Uranium has been mined since the 1940s, with historical production generally well-documented. However, there remains some uncertainty about the amount mined in the Soviet Union between 1945 and 1990. The following table summarizes historical uranium production by country:
| Country | Cumulative Production (tU) |
|---|---|
| Canada | 554,475 |
| United States | 378,038 |
| USSR* | 377,613 |
| Kazakhstan | 349,789 |
| Australia | 240,579 |
| Germany | 219,685 |
| South Africa | 165,692 |
| Namibia | 158,856 |
| Niger | 156,797 |
| Czech Republic | 112,055 |
| Russia | 90,725 |
| Uzbekistan | 76,808 |
| France | 76,021 |
| China | 53,712 |
| Ukraine | 24,670 |
| Others | 149,299 |
| Total | 3,184,812 |
*Until 1991, the USSR included uranium produced in Russia, Kazakhstan, Uzbekistan, Ukraine, and other former Soviet Union republics.
4.1. Phases of Uranium Production: A Historical Overview
Uranium production from 1945 to 2022 can be divided into four distinct phases:
- Military Era (1945 to mid-1960s): Production was driven by the nuclear arms race, with electricity generation from nuclear fuel being secondary.
- Civil Nuclear Power Expansion (mid-1960s to mid-1980s): Rapid growth in civil nuclear power led to increased uranium production, supported by long-term contracts with utilities.
- Supply Overhang (mid-1980s to about 2002): Nuclear construction cutbacks and the arrival of uranium from the former Soviet Union created a supply surplus.
- Market Reaction (early 2000s to present): Anticipation of a nuclear renaissance led to a strong market reaction, with uranium prices increasing significantly before correcting after the Fukushima accident.
4.2. The Impact of Fukushima on Uranium Prices
The Fukushima accident in 2011 had a significant impact on uranium prices. The accident led to a downward correction in prices, which fell to some of the lowest inflation-adjusted levels ever experienced. This decline was due to reduced demand for nuclear power as countries re-evaluated their nuclear programs and some reactors were taken offline. This underscores the sensitivity of uranium prices to geopolitical and safety-related events.
5. Reactor Fuel Requirements: The Demand Side
The world’s power reactors, with a combined capacity of about 400 GWe, require approximately 67,500 tonnes of uranium annually. This demand is influenced by factors such as reactor capacity factors, power levels, fuel burn-up, and other efficiencies.
5.1. Factors Influencing Uranium Fuel Demand
Several factors influence uranium fuel demand. Higher capacity factors and reactor power levels tend to increase demand, while higher fuel burn-up and other efficiencies can offset this increase. Over the years, electricity generated by nuclear power has increased more rapidly than uranium consumption, indicating improved fuel efficiency. The world’s measured resources of uranium are sufficient to last for about 90 years, assuming current consumption rates and conventional reactor usage.
5.2. Efficiency Improvements in Reactor Fuel Consumption
Efficiency improvements in reactor fuel consumption have reduced the amount of natural uranium required for a given amount of fuel. Reducing the tails assay in enrichment and reprocessing used fuel from conventional light water reactors also contribute to more efficient resource utilization. The OECD NEA & IAEA have recognized these trends, reducing the generic reactor fuel consumption estimate in their reports.
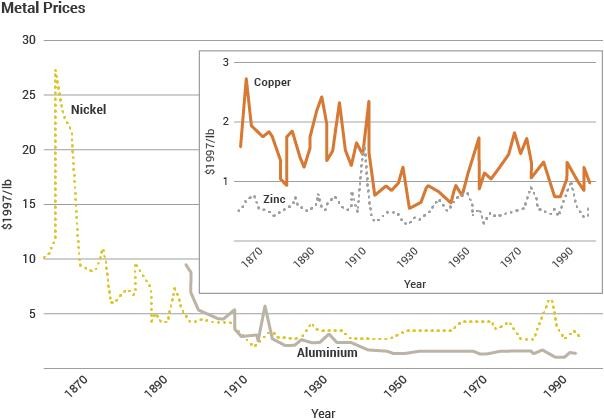
This line graph tracks metal prices over time, providing a visual representation of the fluctuations and trends in commodity markets.
6. Secondary Sources of Uranium: Supplementing Primary Supply
Today’s reactor fuel requirements are met from primary supply and various secondary sources. These include commercial stockpiles, nuclear weapons stockpiles, recycled plutonium and uranium from reprocessing used fuel, and re-enrichment of depleted uranium tails.
6.1. Civil Stockpiles
Civil stockpiles held by utilities and governments represent a significant secondary source of uranium. The exact amount held is difficult to quantify due to commercial confidentiality. At the end of 2020, total inventory was estimated at 282,000 tU, distributed among utilities in the USA, EU, China, India, and other East Asian countries. These reserves are maintained at a high level to ensure energy security.
6.2. Military Warheads
Military warheads have been an important source of nuclear fuel since 1987. Disarmament treaties between the USA and countries of the former USSR led to the reduction of nuclear arsenals, with uranium from warheads being converted into reactor fuel. This program, known as “Megatons to Megawatts,” eliminated enough bomb-grade material for 20,000 nuclear warheads and provided about 15% of the world’s reactor requirements until 2013.
6.3. Recycled Uranium and Plutonium
Recycled uranium and plutonium from reprocessing used fuel is another valuable secondary source. Plutonium is quickly recycled as MOX fuel, while reprocessed uranium (RepU) is mostly stockpiled. However, some RepU has been used to make enriched AGR fuel in the UK and has been recycled into nuclear power plants in Belgium, France, Germany, and Switzerland. Recycling saves about 2000 tU per year of primary supply.
6.4. Re-Enrichment of Depleted Uranium
Re-enrichment of depleted uranium (DU) tails is an additional secondary source. There is about 1.2 million tonnes of depleted uranium available from military and civil enrichment activities. Some DU with relatively high assay can be fed through enrichment plants to produce natural uranium equivalent or enriched uranium ready for fuel fabrication.
6.5. Underfeeding at Enrichment Plants
Underfeeding at enrichment plants is a significant source of secondary supply. This occurs when the operational tails assay is lower than the contracted assay, allowing the enricher to set aside surplus natural uranium for sale. This source is estimated to provide 3500-7000 tU/yr to the mid-2020s.
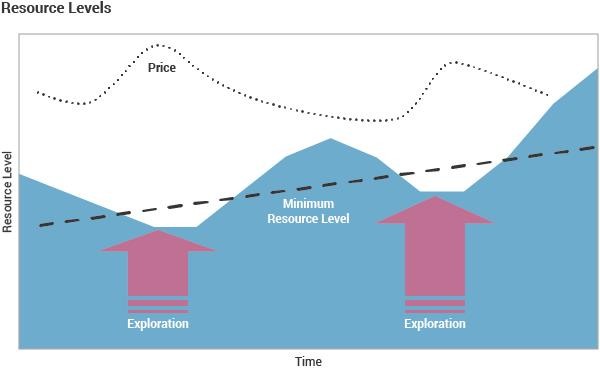
This graphic illustrates different resource levels, from measured and indicated to inferred, providing a visual representation of resource classification.
7. International Fuel Reserves: Ensuring Supply Security
To ensure fuel supply in case of political interruptions or supply disruptions, several international initiatives have been established to create international reserves of enriched fuel.
7.1. Russian LEU Reserve
Russia opened an international fuel bank at its Angarsk enrichment facility in December 2010. The fuel bank, under IAEA control, holds 123 tU as LEU enriched to between 2.0% and 4.95% U-235. This fuel is available to any IAEA member state in good standing that is unable to procure LEU for political reasons.
7.2. IAEA LEU Bank
The IAEA board established a similar guaranteed reserve of low-enriched uranium, the IAEA LEU Bank, in December 2010. This bank comprises a physical stock of UF6 owned by the IAEA and located in Kazakhstan. It serves as a potential supply of 90 tonnes LEU for the production of fuel assemblies for nuclear power plants. The IAEA LEU Bank is fully funded by voluntary contributions from various countries and organizations.
7.3. American Assured Fuel Supply
In 2005, the US government announced plans to establish a mechanism to ensure fuel supply for commercial reactors in foreign countries facing supply disruption. This program, known as the American Assured Fuel Supply (AFS), comprises 286 tonnes of low-enriched uranium. The AFS is administered by the US National Nuclear Safety Administration, and foreign access must be through a US entity, with fuel sold at current market prices.
8. Unconventional Resources: Expanding the Uranium Base
In addition to known recoverable resources, there are substantial amounts of unconventional resources from which uranium can be produced as a by-product of other mining activities.
8.1. Rock Phosphate
Rock phosphate, or phosphorite, is a major unconventional resource for uranium. Approximately 20,000 tU has been recovered as a by-product of agricultural phosphate production. Estimates of the amount available range from 9 to 22 million tonnes of uranium. Morocco has the largest known resources of uranium in phosphate rock.
8.2. Rare Earth Element Deposits
Rare earth element (REE) deposits are another unconventional resource. REEs have unique properties and are used in many modern technologies. Kvanefjeld in Greenland is a major REE deposit with significant potential for uranium production, with a total of 228,000 tU.
8.3. Black (Alum) Shales
Black (Alum) shales are another unconventional resource. The Red Book tabulates about 300,000 tU in Sweden and 25,500 tU in Finland at the Sotkamo mine of Terrafame Oy, where uranium recovery by heap leaching is permitted.
9. Thorium as a Nuclear Fuel: An Alternative
While uranium is currently the only fuel supplied for nuclear reactors, thorium can also be utilized as a fuel in CANDU reactors or in reactors specifically designed for this purpose. Thorium is reported to be about three times as abundant in the Earth’s crust as uranium. The thorium fuel cycle has some attractive features, though it is not yet in commercial use.
10. Conclusion: The Future of Uranium Supply
The question of how much uranium is on Earth is complex. Uranium is a relatively common element, but its economic availability depends on various factors including market prices, extraction technology, and geological knowledge. With continued exploration, technological advancements, and the utilization of secondary and unconventional resources, the world’s uranium supply is expected to remain sustainable for the foreseeable future.
10.1. The Expertise of HOW.EDU.VN
At HOW.EDU.VN, we provide expert guidance and strategic advice on uranium resources and nuclear energy. Our team of PhDs and industry experts can help you navigate the complexities of the uranium market, assess investment opportunities, and develop sustainable energy strategies. With our comprehensive analysis and personalized consulting services, you can make informed decisions and achieve your goals.
Are you seeking expert advice on uranium resources or nuclear energy? Contact HOW.EDU.VN today to connect with our team of PhDs and industry leaders. We offer personalized consulting services to help you navigate the complexities of the uranium market and develop sustainable energy strategies. Visit our website at HOW.EDU.VN or contact us at +1 (310) 555-1212. Our address is 456 Expertise Plaza, Consult City, CA 90210, United States. Let HOW.EDU.VN be your trusted partner in the world of uranium and nuclear energy.
This image represents economic adjustments in supply, showcasing how market dynamics and technological advancements influence resource availability.
11. FAQs on Uranium Resources and Availability
1. How much uranium is estimated to be on Earth?
While the exact amount is unknown, uranium is relatively common in the Earth’s crust, with an average concentration of 2.8 ppm.
2. Which countries have the largest uranium resources?
Australia, Kazakhstan, and Canada hold the largest shares of the world’s uranium resources.
3. What is the primary use of uranium?
The primary use of uranium is as fuel for nuclear power reactors.
4. How long will the world’s uranium resources last?
The world’s measured resources of uranium are estimated to last for about 90 years at current consumption rates.
5. What are the secondary sources of uranium?
Secondary sources of uranium include civil stockpiles, military warheads, recycled uranium and plutonium, and re-enrichment of depleted uranium tails.
6. What are unconventional uranium resources?
Unconventional uranium resources include rock phosphate, rare earth element deposits, and black shales.
7. How does the price of uranium affect resource availability?
Higher uranium prices can make previously uneconomical deposits viable, increasing the total estimated resources.
8. What impact did the Fukushima accident have on uranium prices?
The Fukushima accident led to a downward correction in uranium prices due to reduced demand for nuclear power.
9. Can thorium be used as a nuclear fuel?
Yes, thorium can be used as a nuclear fuel in CANDU reactors or in reactors specifically designed for this purpose.
10. How can HOW.EDU.VN help with uranium resource assessments?
HOW.EDU.VN offers expert guidance and strategic advice on uranium resources and nuclear energy, helping clients navigate the complexities of the uranium market and develop sustainable energy strategies.
12. Glossary of Terms
- Uranium (U): A radioactive chemical element used as a fuel in nuclear reactors.
- Parts Per Million (ppm): A unit of concentration measuring the amount of a substance per million units of the total mixture.
- Ore: A natural rock or sediment that contains one or more valuable minerals, typically metals, that can be extracted, treated, and sold at a profit.
- Reasonably Assured Resources (RAR): Uranium resources that occur in known ore deposits of such grade, quantity, and location that they can be recovered within given production cost ranges, with current technology.
- Inferred Resources: Uranium resources inferred from geological evidence, sampling, and limited testing, but with less certainty than reasonably assured resources.
- Tonnes U (tU): Metric tonnes of uranium.
- OECD NEA: Organisation for Economic Co-operation and Development Nuclear Energy Agency.
- IAEA: International Atomic Energy Agency.
- GWe: Gigawatts electric, a unit of power.
- LEU: Low-Enriched Uranium, uranium with a U-235 concentration below 20%.
- UF6: Uranium hexafluoride, a compound used in the uranium enrichment process.
- MOX Fuel: Mixed Oxide Fuel, a blend of plutonium and uranium oxides used in nuclear reactors.
- Depleted Uranium (DU): Uranium with a lower concentration of U-235 than natural uranium.
- Thorium (Th): A radioactive chemical element that can be used as a nuclear fuel.
- CANDU Reactor: Canadian Deuterium Uranium reactor, a type of nuclear reactor that can use natural uranium as fuel.
- Black Shales: Dark-colored sedimentary rocks that contain significant amounts of organic matter and uranium.
13. References
- OECD NEA & IAEA, Uranium 2020: Resources, Production and Demand
- OECD NEA & IAEA, Uranium 2018: Resources, Production and Demand
- World Nuclear Association, 2019, The Nuclear Fuel Report – Global Scenarios for Demand and Supply Availability 2019-2040
- World Nuclear Association, 2019, The Nuclear Fuel Report – Global Scenarios for Demand and Supply Availability 2021-2040
- UN Institute for Disarmament Research, Yury Yudin (ed) 2011, Multilateralization of the Nuclear Fuel Cycle – The First Practical Steps
- A. Monnet, CEA, Uranium from Coal Ash: Resource assessment and outlook, IAEA URAM 2014
how.edu.vn: Your Expert Resource for Uranium and Nuclear Energy Insights.