In the realm of mathematics and statistics, probability stands as a fundamental concept, quantifying the likelihood of an event occurring. From predicting weather patterns to assessing risks in financial markets, understanding How To Calculate Probability is crucial in various fields and everyday decision-making. This guide provides a step-by-step approach to mastering probability calculations, covering basic principles and delving into more complex scenarios like mutually exclusive, independent, and conditional probabilities.
Concepts of probability are introduced as early as 7th grade, forming a building block in statistics and probability curriculum through high school and beyond. This article aims to enhance your understanding of probability, whether you are a student just starting out or someone looking to refresh your knowledge.
Understanding the Basics of Probability
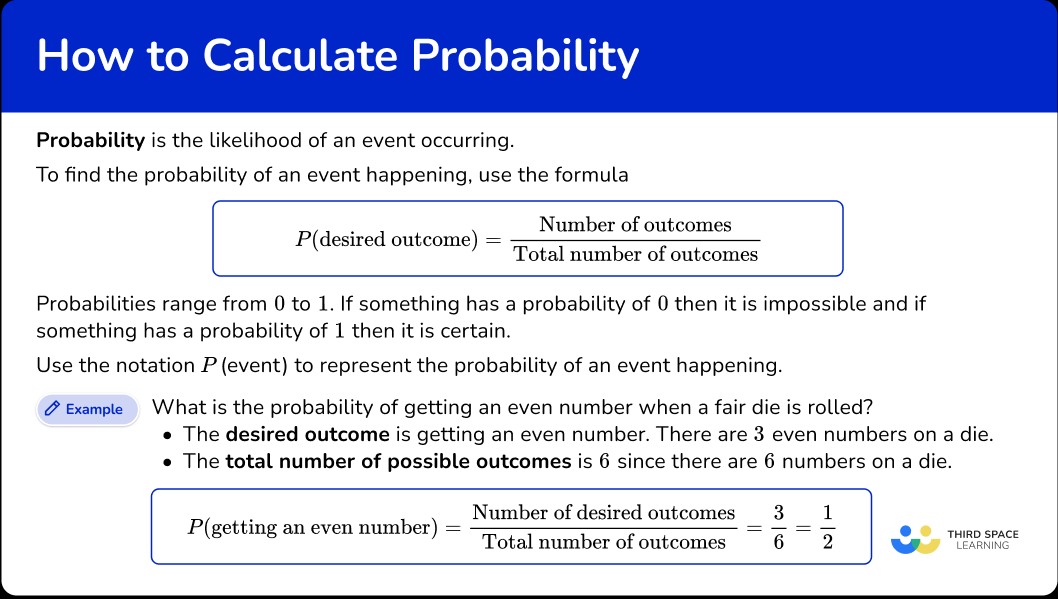
Probability is essentially the measure of how likely an event is to happen. It’s quantified as a number between 0 and 1, where 0 indicates impossibility and 1 indicates certainty. Probability can be expressed as fractions, decimals, or percentages.
To calculate the basic probability of an event, we use a simple yet powerful formula:
$$
text{Probability} = frac{text{Number of Favorable Outcomes}}{text{Total Number of Possible Outcomes}}
$$
Let’s illustrate this with a classic example: rolling a fair six-sided die. Suppose we want to find the probability of rolling an even number.
- Desired outcomes (favorable outcomes): Rolling an even number. On a standard die, the even numbers are 2, 4, and 6. Thus, there are 3 favorable outcomes.
- Total possible outcomes: When rolling a die, there are 6 possible outcomes: 1, 2, 3, 4, 5, and 6.
Applying the formula:
$$
text{Probability of rolling an even number} = frac{3}{6} = frac{1}{2} = 0.5 = 50%
$$
This means there’s a 50% chance of rolling an even number when you roll a fair die.
We often use the notation $P(text{event})$ to denote the probability of a specific event. For instance, the probability of rolling a 1 can be written as $P(1)$.
The sample space is the set of all possible outcomes of an experiment. For a single die roll, the sample space is {1, 2, 3, 4, 5, 6}. For more complex scenarios, like flipping a coin three times, the sample space expands considerably, including all combinations of heads and tails.
Calculating Probabilities of Combined Events
Often, we’re interested in the probability of multiple events occurring together or in sequence. This involves different probability rules based on how the events are related.
Mutually Exclusive Events: The “OR” Rule
Mutually exclusive events are events that cannot happen at the same time. For example, when flipping a coin, you can get either heads or tails, but not both simultaneously. To find the probability of one or another of mutually exclusive events occurring, we use the Addition Rule:
$$
P(A text{ or } B) = P(A) + P(B)
$$
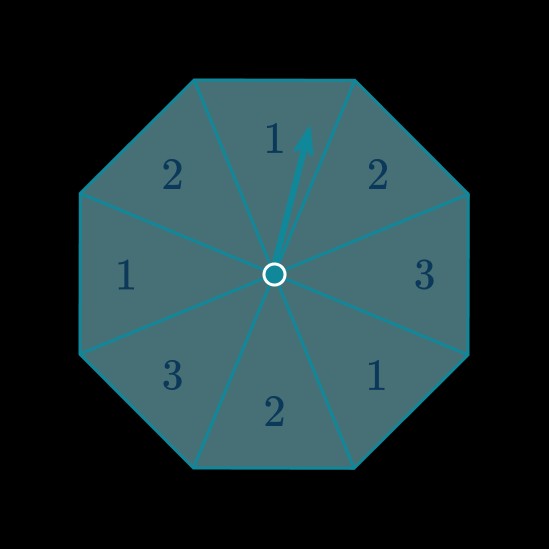
Consider a spinner divided into equal sections labeled 1, 2, and 3, with varying numbers of sections for each number. Let’s calculate the probability of landing on a 2 or a 3.
- Probability of landing on 2, $P(2) = frac{3}{8}$ (since there are 3 sections labeled 2 out of 8 total sections).
- Probability of landing on 3, $P(3) = frac{2}{8}$ (since there are 2 sections labeled 3 out of 8 total sections).
Using the Addition Rule for mutually exclusive events:
$$
P(2 text{ or } 3) = P(2) + P(3) = frac{3}{8} + frac{2}{8} = frac{5}{8}
$$
Therefore, the probability of landing on a 2 or a 3 is $frac{5}{8}$.
Independent Events: The “AND” Rule
Independent events are events where the outcome of one event does not affect the outcome of another. For example, if you flip a coin and then roll a die, the result of the coin flip does not influence the result of the die roll. To find the probability of two independent events both occurring, we use the Multiplication Rule:
$$
P(A text{ and } B) = P(A) times P(B)
$$
Let’s consider flipping a fair coin and rolling a fair die. What’s the probability of getting heads on the coin and rolling a 1 on the die?
- Probability of getting heads, $P(text{Head}) = frac{1}{2}$.
- Probability of rolling a 1, $P(1) = frac{1}{6}$.
Using the Multiplication Rule for independent events:
$$
P(text{Head and } 1) = P(text{Head}) times P(1) = frac{1}{2} times frac{1}{6} = frac{1}{12}
$$
Thus, the probability of flipping heads and rolling a 1 is $frac{1}{12}$.
We can visualize the sample space of this combined event using a table:
| 1 | 2 | 3 | 4 | 5 | 6 | |
|---|---|---|---|---|---|---|
| Heads | H, 1 | H, 2 | H, 3 | H, 4 | H, 5 | H, 6 |
| Tails | T, 1 | T, 2 | T, 3 | T, 4 | T, 5 | T, 6 |
Each cell in this table represents an equally likely outcome, and there are 12 outcomes in total, with only one being (Heads, 1).
Conditional Probability: Events with Dependence
Conditional probability deals with the probability of an event occurring given that another event has already occurred. This is important when events are dependent, meaning the outcome of one event affects the probability of the other. The formula for conditional probability is:
$$
P(A|B) = frac{P(A text{ and } B)}{P(B)}
$$
Where $P(A|B)$ is the probability of event A occurring given that event B has occurred.
Consider a bag with 7 red marbles and 5 blue marbles. If you pick one marble at random and it is red, what is the probability that the second marble you pick (without replacement) is also red?
- Probability of the first marble being red, $P(text{First Red}) = frac{7}{12}$ (7 red marbles out of 12 total).
- Given that the first marble was red, there are now 6 red marbles and 11 total marbles left.
- Probability of the second marble being red, given the first was red, $P(text{Second Red} | text{First Red}) = frac{6}{11}$ (6 red marbles left out of 11 total).
Therefore, the conditional probability of picking a second red marble after picking a first red marble is $frac{6}{11}$.
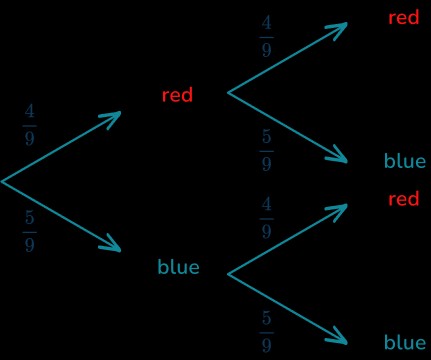
Visualizing with Tree Diagrams
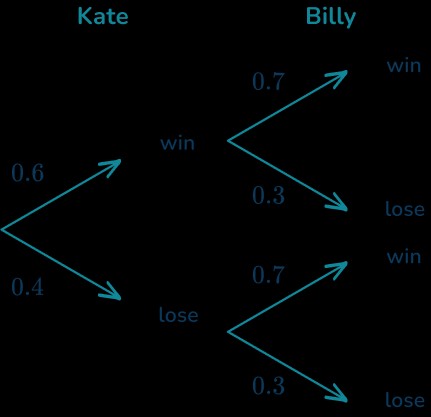
Tree diagrams are particularly useful for visualizing sequences of events and their probabilities, especially in cases of conditional probability.
Consider Kate and Billy playing tennis. Suppose the probability that Kate wins a game is 0.6, and the probability that Billy wins is 0.7. If Kate plays on Saturday and Billy on Sunday, we can use a tree diagram to find the probability that one wins and the other loses.
- $P(text{Kate Wins}) = 0.6$, so $P(text{Kate Loses}) = 1 – 0.6 = 0.4$.
- $P(text{Billy Wins}) = 0.7$, so $P(text{Billy Loses}) = 1 – 0.7 = 0.3$.
We are interested in two scenarios: (Kate wins AND Billy loses) OR (Kate loses AND Billy wins).
- $P(text{Kate Wins and Billy Loses}) = P(text{Kate Wins}) times P(text{Billy Loses}) = 0.6 times 0.3 = 0.18$.
- $P(text{Kate Loses and Billy Wins}) = P(text{Kate Loses}) times P(text{Billy Wins}) = 0.4 times 0.7 = 0.28$.
Since these two scenarios are mutually exclusive (only one of these combinations can occur), we add their probabilities:
$$
P(text{One Wins and One Loses}) = 0.18 + 0.28 = 0.46
$$
The probability that one of them wins and the other loses is 0.46 or 46%.
Using Venn Diagrams for Probability
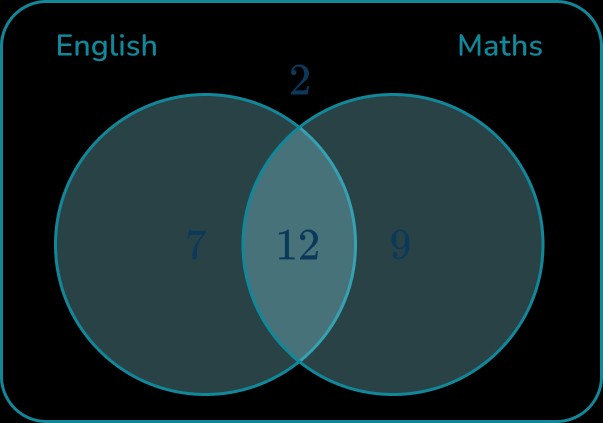
Venn diagrams are helpful for visualizing probabilities, especially when dealing with overlapping events or conditional probabilities within sets.
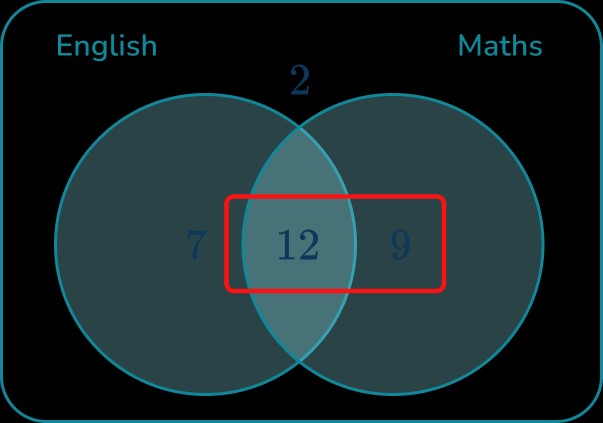
Consider a Venn diagram showing the number of students who passed English and Math.
Suppose we want to find the probability that a student did not pass English given that they passed Math.
- Total students who passed Math = 12 (passed both) + 9 (passed Math only) = 21.
- Number of students who passed Math but not English = 9.
The conditional probability of not passing English given they passed Math is:
$$
P(text{Not English} | text{Math}) = frac{text{Number of students passed Math but not English}}{text{Total number of students passed Math}} = frac{9}{21} = frac{3}{7}
$$
Step-by-Step Guide to Calculating Probability
To effectively calculate probability, follow these steps:
- Identify the Sample Space: Determine all possible outcomes of the event or experiment.
- Determine Favorable Outcomes: Identify the outcomes that meet the specific condition for which you want to calculate the probability.
- Apply the Probability Formula: Use the basic probability formula or appropriate rules (Addition, Multiplication, Conditional Probability) based on the nature of the events.
- Solve and Simplify: Calculate the probability and simplify the result, if possible, expressing it as a fraction, decimal, or percentage.
Examples of Probability Calculations
Example 1: Basic Probability
Jamie has cards with letters P, R, O, B, A, B, I, L, I, T, Y. If a card is chosen at random, what is the probability it has a letter B on it?
- Sample Space: {P, R, O, B, A, B, I, L, I, T, Y} – 11 cards in total.
- Favorable Outcomes: Cards with the letter B – there are 2.
- Probability: $P(text{B}) = frac{2}{11}$.
Example 2: Mutually Exclusive Events
Using the spinner example from earlier, what is the probability of landing on a 2 or a 3? We already calculated this as $P(2 text{ or } 3) = frac{5}{8}$.
Example 3: Independent Events
Olivia flips a coin and rolls a die. What is the probability of getting heads and a 1? We calculated this as $P(text{Head and } 1) = frac{1}{12}$.
Example 4: Conditional Probability
In the marble bag example, if the first marble drawn is red, what is the probability the second is also red? We found $P(text{Second Red} | text{First Red}) = frac{6}{11}$.
Example 5: Using Tree Diagrams
For Kate and Billy’s tennis matches, we found the probability of one winning and one losing to be 0.46.
Example 6: Using Venn Diagrams
For the student pass rates in Math and English, we found the probability of not passing English given passing Math to be $frac{3}{7}$.
Teaching Tips for Probability
- Hands-on Experiments: Start with practical experiments like coin flips, dice rolls, or card draws to build intuition and allow students to create frequency tables and graphs.
- Visual Aids: Use visual aids such as spinners, marbles, and diagrams (tree diagrams, Venn diagrams) to make abstract concepts more concrete.
- Probability Calculators: Allow students to check their work using probability calculators or software, especially during independent practice.
Common Mistakes to Avoid
- Confusing Favorable and Total Outcomes: Always ensure the numerator is the number of favorable outcomes and the denominator is the total number of possible outcomes.
- Misapplying Probability Rules: Use the correct rule (Addition for “OR”, Multiplication for “AND”) based on whether events are mutually exclusive or independent.
- Fraction Errors: Be careful with fraction operations, especially addition, subtraction, multiplication, and division. Ensure common denominators when adding or subtracting.
- Ignoring Dependence in Conditional Probability: Remember to adjust probabilities for subsequent events in conditional probability problems, especially without replacement.
Practice Questions
Test your understanding with these practice questions:
-
Show the sample space of flipping a fair coin and drawing a marble from a bag containing 2 blue, 1 orange, and 1 green marble.
-
Luke draws a card from a standard deck of 52 playing cards. What is the probability he picks a King?
-
Eddy has 10 red, 8 blue, and 2 yellow socks. He picks one red sock, then picks a second without replacement. What is the probability the second sock is also red?
-
The probability of Tom wearing different color t-shirts is given. What is the probability he wears a black or gray t-shirt?
-
Evie’s bus is late with a probability of $frac{2}{5}$ each day, independently. What is the probability the bus is late two days in a row?
-
Rachel picks a marble from a bag of 4 blue and 5 red marbles, replaces it, and picks again. What is the probability both marbles are the same color?
Frequently Asked Questions About Probability
What is the difference between theoretical and experimental probability?
Theoretical probability is calculated mathematically based on possible outcomes, while experimental probability is derived from actual experiments and observations. For example, the theoretical probability of rolling a 6 on a die is $frac{1}{6}$. If you roll a die 100 times and get a 6 twenty times, the experimental probability is $frac{20}{100} = frac{1}{5}$.
What is probability distribution?
A probability distribution shows all possible values and their associated probabilities for a random variable. Common examples include binomial and normal distributions.
What is Bayes’ Theorem?
Bayes’ Theorem provides a formula to calculate conditional probabilities, especially useful for updating probabilities based on new evidence.
Further Learning in Probability
Continue your learning with these related topics:
- Compound Probability
- Probability Distributions
- Units of Measurement
Need More Help with Math?
Third Space Learning specializes in providing personalized math support through online one-on-one tutoring. Our expert tutors help students from grade 7 onwards to build confidence and accelerate their progress in math.
Discover more about our math tutoring programs and how we can support your students’ success.