In statistics, understanding how often events occur is crucial. While frequency simply counts occurrences, relative frequency provides a more insightful perspective by showing the proportion of occurrences in relation to the total number of events. This concept is fundamental in data analysis, probability, and various real-world applications.
This guide will delve into the concept of relative frequency, explaining what it is, how to calculate it, and its significance in understanding data. Whether you’re a student learning statistics or someone looking to analyze data in everyday life, mastering relative frequency is a valuable skill.
Example of Relative Frequency
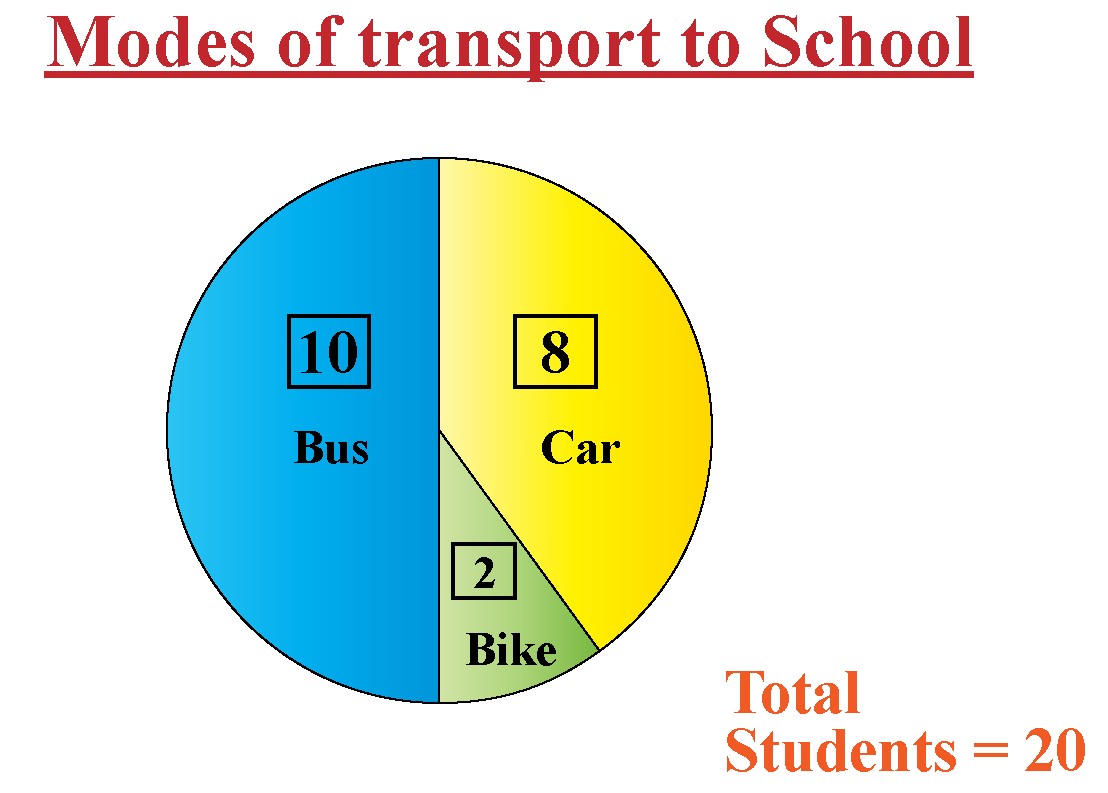
Consider a simple example: In a class of 20 students, 8 students travel to school by car.
-
The frequency of students traveling by car is 8.
-
The relative frequency of students traveling by car is calculated as:
[dfrac {8}{20} = 0.4 = 40%]
This means that 40% of the students in the class travel to school by car. This proportion, or relative frequency, gives us a clearer picture compared to just knowing the raw count of 8 students.
In this comprehensive guide, we will cover:
Understanding Relative Frequency: Definition and Basics
What is Relative Frequency?
Relative frequency is defined as the ratio of the number of times a specific event occurs to the total number of events or trials in a given experiment or observation. It essentially tells you what proportion of the time an event happens within a larger set of occurrences.
To calculate relative frequency, you need two key pieces of information:
- Frequency of the event (Subgroup frequency): This is the number of times the specific event you are interested in occurs.
- Total frequency (Total number of events/trials): This is the total count of all events or trials conducted.
The formula for relative frequency is straightforward:
| Relative Frequency = (Subgroup Frequency) / (Total Frequency) |
|---|


This ratio can be expressed as a fraction, decimal, or percentage, making it easy to interpret and compare across different datasets.
Illustrative Example: Favorite Sports Survey
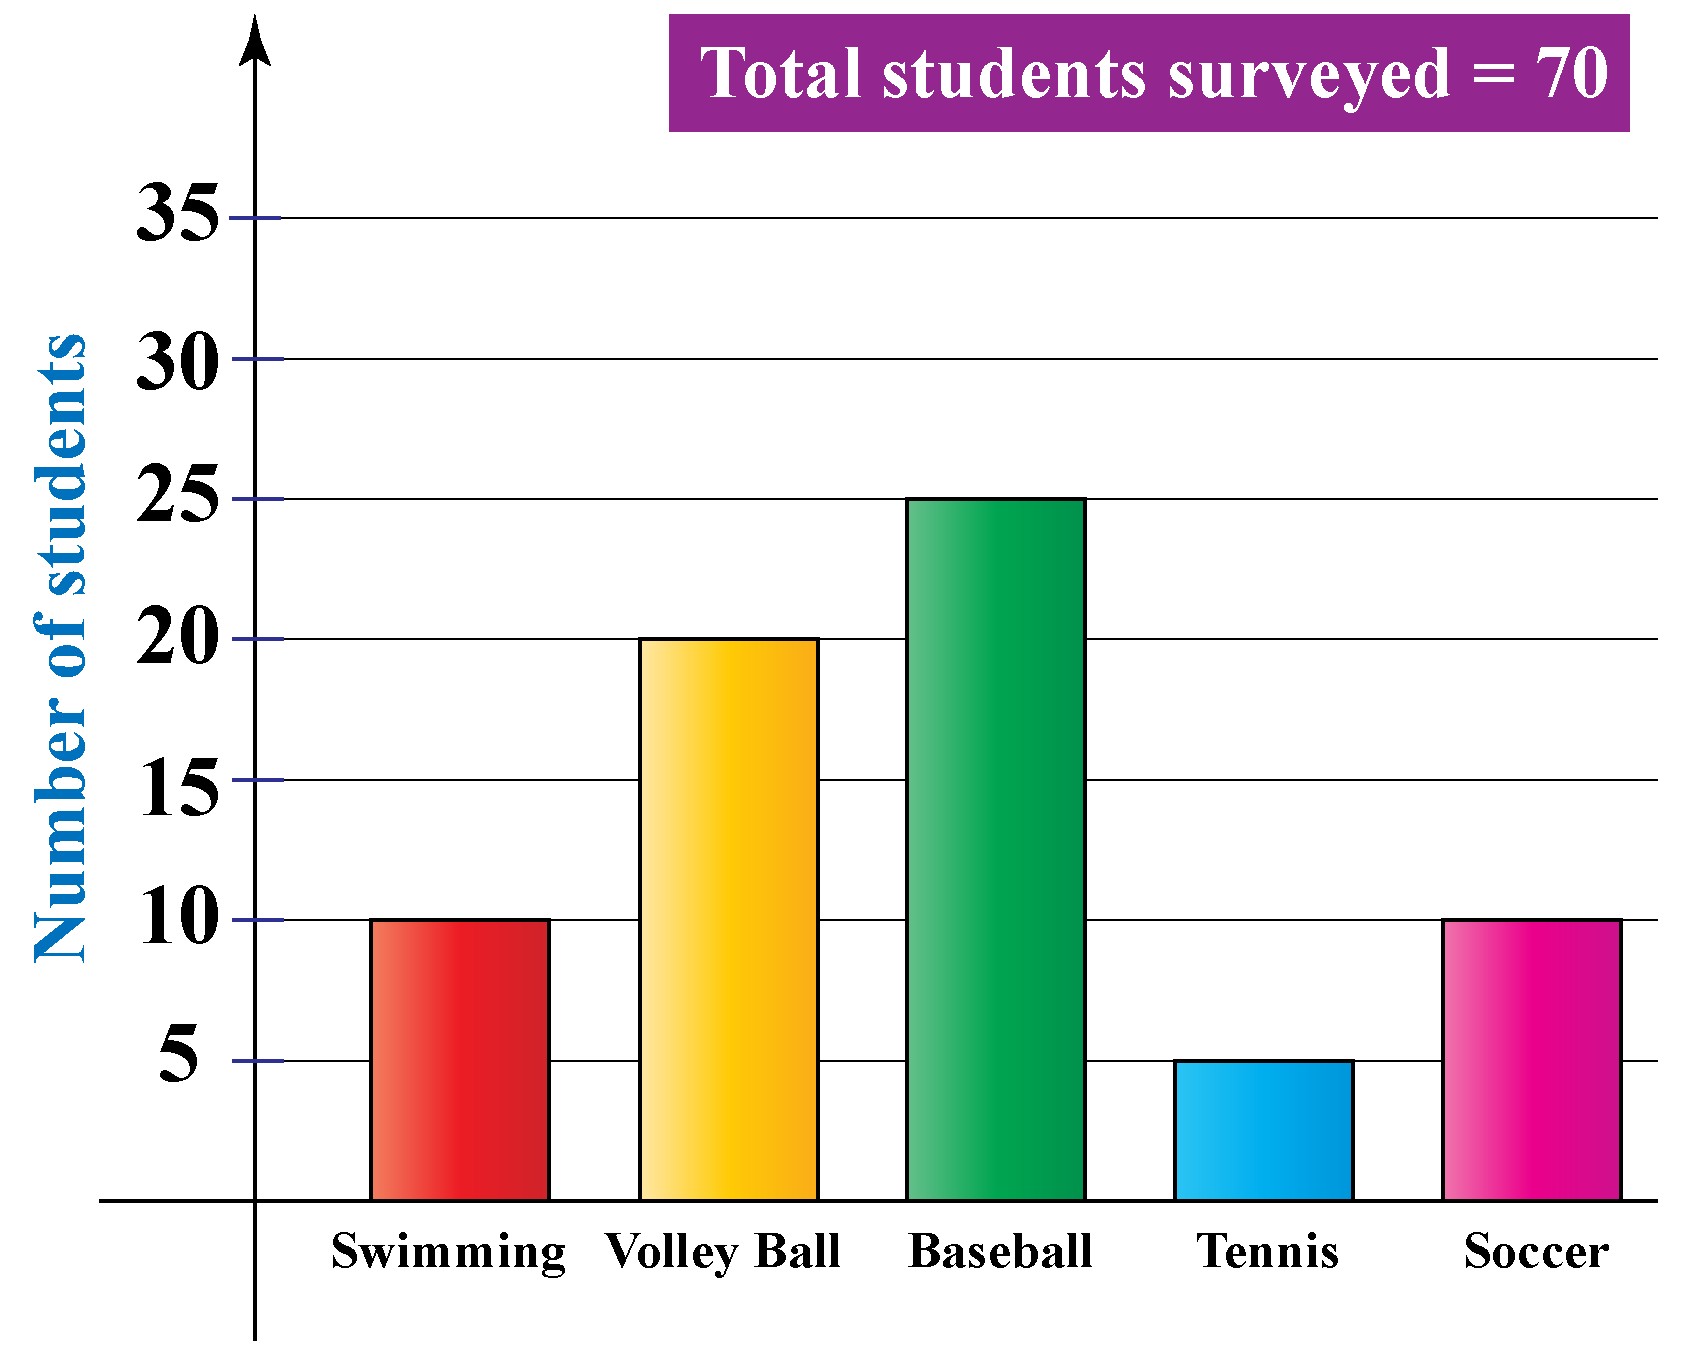
Let’s consider another example to solidify our understanding. Imagine Ellie conducts a survey in her school to find out students’ favorite sports. She collects the following data:
To find the relative frequency for volleyball, we need to follow these steps:
-
Find the total number of students surveyed: Add the frequencies for all sports: 10 (Basketball) + 20 (Volleyball) + 25 (Soccer) + 5 (Tennis) + 10 (Badminton) = 70 students.
-
Identify the frequency of students who like volleyball: From the data, 20 students like volleyball.
-
Calculate the relative frequency for volleyball: Divide the frequency of volleyball by the total number of students:
Relative Frequency (Volleyball) = 20 / 70 = 0.2857 (approximately)
Expressed as a percentage, the relative frequency of students who prefer volleyball is approximately 28.57%. This indicates that in Ellie’s survey, about 28.57% of students favor volleyball.
Understanding Cumulative Relative Frequency
What is Cumulative Frequency?
In statistics, cumulative frequency is the running total of frequencies. It’s calculated by adding the frequency of the current category to the sum of frequencies of all preceding categories. This is particularly useful when data is ordered or grouped into intervals.
How to Calculate Cumulative Frequency and Cumulative Relative Frequency
Let’s extend our understanding with an example of toy car sales. Robert, a sales manager, tracks quarterly sales data.
| Month | Number of Toy Cars Sold (Frequency) | Total Number of Toy Cars Sold (Cumulative Frequency) | Cumulative Relative Frequency |
|---|---|---|---|
| January | 20 | 20 | 20/83 = 0.2410 |
| February | 30 | 20 + 30 = 50 | 50/83 = 0.6024 |
| March | 15 | 50 + 15 = 65 | 65/83 = 0.7831 |
| April | 18 | 65 + 18 = 83 | 83/83 = 1.0000 |
In this table:
- Cumulative Frequency is calculated by adding the current month’s sales to the cumulative sales of the previous months.
- Cumulative Relative Frequency is obtained by dividing the cumulative frequency for each month by the total sales for all months (83 in this case).
Notice that the final cumulative frequency equals the total frequency, and the final cumulative relative frequency is always 1 (or 100%). Cumulative relative frequency shows the proportion of total events that have occurred up to a certain point.
Relative Frequency Formula: The General Approach
The general formula for relative frequency is simple and versatile:
[text{Relative Frequency} = dfrac{text{Frequency of the event (f)}}{text{Total number of data values (n)}}]
Where:
- f represents the frequency of the specific event or category.
- n represents the total number of observations or trials.
This formula is applicable across various scenarios and data types.
Probability vs. Relative Frequency: Key Differences
While often related, probability and relative frequency are distinct concepts. Understanding their differences is crucial in statistics.
| Feature | Probability | Relative Frequency |
|---|---|---|
| Nature | Theoretical | Practical/Empirical |
| Definition | Measure of the likelihood of an event occurring | Measure of how often an event has occurred |
| Application | Expected events, equally likely outcomes | Actual events that have already happened |
| Context | Before an event occurs | After or during a series of events (trials) |
Probability is a theoretical concept that predicts the likelihood of an event based on possible outcomes. For example, the probability of flipping a fair coin and getting heads is 0.5 (or 50%) because there are two equally likely outcomes (heads or tails).
Relative frequency, on the other hand, is based on observed data from actual experiments or observations. It reflects what actually happened in a series of trials.
Example: Cards and Probability vs. Relative Frequency
-
Probability Example: In a standard deck of 52 cards, there are 26 black cards. The probability of drawing a black card randomly is:
[text{Probability (Black Card)} = dfrac{text{Number of black cards}}{text{Total number of cards}} = dfrac{26}{52} = dfrac{1}{2} = 0.5 = 50%]
This is a theoretical probability, calculated based on the composition of the deck.
-
Relative Frequency Example: Suppose you draw a card from the deck, note its color, and replace it. You repeat this process 10 times and find that you drew a black card 4 times. The relative frequency of drawing a black card in this experiment is:
[text{Relative Frequency (Black Card)} = dfrac{text{Number of times black cards were picked}}{text{Total number of trials}} = dfrac{4}{10} = 0.4 = 40%]
This relative frequency is based on the actual outcomes of your 10 trials. In a larger number of trials, the relative frequency is expected to approach the theoretical probability. This is known as the Law of Large Numbers.
Applying the Relative Frequency Formula: Solved Problems
Let’s work through some examples to see how to use the relative frequency formula in practice.
Problem 1: In a class of 16 students, there are 6 boys and 10 girls. Find the relative frequency of boys in the class.
Solution:
-
Frequency of boys (f) = 6
-
Total number of students (n) = 16
[text{Relative Frequency (Boys)} = dfrac{text{Number of boys}}{text{Total number of students}} = dfrac{6}{16} = 0.375 = 37.5%]
The relative frequency of boys in the class is 37.5%.
Problem 2: A die is tossed 30 times and lands on the number 6 five times. What is the relative frequency of observing a 6?
Solution:
-
Frequency of landing on 6 (f) = 5
-
Total number of tosses (n) = 30
[text{Relative Frequency (Landing on 6)} = dfrac{text{Number of times die landed on 6}}{text{Total number of tosses}} = dfrac{5}{30} = dfrac{1}{6} approx 0.1667 = 16.67%]
The relative frequency of observing a 6 is approximately 16.67%.
Problem 3: Karen surveyed 1000 people in her town about their dietary habits and found 218 vegetarians and 42 vegans. What are the relative frequencies of vegetarians and vegans in her town?
Solution:
-
Vegetarians:
- Frequency of vegetarians (f) = 218
- Total number of people surveyed (n) = 1000
[text{Relative Frequency (Vegetarians)} = dfrac{218}{1000} = 0.218 = 21.8%]
-
Vegans:
- Frequency of vegans (f) = 42
- Total number of people surveyed (n) = 1000
[text{Relative Frequency (Vegans)} = dfrac{42}{1000} = 0.042 = 4.2%]
The relative frequency of vegetarians is 21.8%, and the relative frequency of vegans is 4.2%.
Problem 4: A tire company tested 600 tires and found that 560 tires lasted for 10,000 miles. Find the relative frequency of tires that did not last 10,000 miles.
Solution:
-
Number of tires that did not last 10,000 miles = 600 – 560 = 40
-
Total number of tires tested (n) = 600
[text{Relative Frequency (Tires not lasting 10,000 miles)} = dfrac{40}{600} = dfrac{2}{30} = dfrac{1}{15} approx 0.0667 = 6.67%]
The relative frequency of tires that did not last 10,000 miles is approximately 6.67%.
Problem 5: A car dealer recorded weekly car sales for a month. Calculate the relative frequency and relative cumulative frequency of sales for each week.
| Week | Number of Cars Sold |
|---|---|
| 1 | 10 |
| 2 | 17 |
| 3 | 14 |
| 4 | 11 |
Solution:
- Total cars sold in the month = 10 + 17 + 14 + 11 = 52
| Week | Cars Sold | Relative Frequency | Relative Cumulative Frequency |
|---|---|---|---|
| 1 | 10 | 10/52 ≈ 0.19 | 0.19 |
| 2 | 17 | 17/52 ≈ 0.33 | 0.19 + 0.33 = 0.52 |
| 3 | 14 | 14/52 ≈ 0.27 | 0.52 + 0.27 = 0.79 |
| 4 | 11 | 11/52 ≈ 0.21 | 0.79 + 0.21 = 1.00 |
This table shows both the relative frequency of sales for each week and the cumulative relative frequency, illustrating the proportion of total sales achieved up to each week.
Key Takeaways: Important Notes on Relative Frequency
Image with “Important Notes” heading.
-
Formula: Relative frequency is calculated as:
Relative Frequency = (Frequency of Event) / (Total Number of Events)
-
Representation: Relative frequency can be expressed as a fraction, decimal, or percentage.
-
Practical Measure: Unlike theoretical probability, relative frequency is a practical measure based on observed data.
-
Law of Large Numbers: As the number of trials increases, the relative frequency tends to approach the theoretical probability of the event.
-
Applications: Relative frequency is widely used in statistics, data analysis, market research, quality control, and many other fields to understand patterns and proportions within data.
Conclusion: Mastering Relative Frequency
Understanding How To Find Relative Frequency is a fundamental step in grasping statistical concepts and analyzing data effectively. It provides a way to express the proportion of occurrences, offering valuable insights beyond simple frequency counts. From surveys to experiments, relative frequency helps us understand the distribution and patterns within datasets. By mastering this concept and its applications, you can enhance your data interpretation skills and make more informed decisions based on empirical evidence.
Frequently Asked Questions (FAQs)
1. What is a relative frequency table?
A relative frequency table is an organized way to present data showing the relative frequencies of different categories or events. It typically includes categories, their frequencies, and their corresponding relative frequencies (often as percentages).
2. How does relative frequency relate to probability in the real world?
In real-world scenarios, especially when theoretical probabilities are unknown or difficult to calculate, relative frequency serves as an empirical estimate of probability. By conducting experiments or observations and calculating relative frequencies, we can approximate the probabilities of events occurring. As the number of observations increases, this approximation generally becomes more accurate.
3. What are conditional relative frequencies and how are they used?
Conditional relative frequencies are used in the context of two-way frequency tables to show the relative frequency of an event occurring given that another event has already occurred. They are calculated for a specific condition or subgroup within the data and help to understand relationships between variables. For example, in a survey about smartphone preferences among different age groups, conditional relative frequency can show the proportion of people in each age group who prefer a particular brand.