Understanding data is crucial in many aspects of life, from analyzing survey results to interpreting sales figures. Among the fundamental concepts in statistics, measures of central tendency help us grasp the typical value within a dataset. Mean, median, and mode are the primary measures, each offering a unique perspective. While mean (average) and median (middle value) are commonly used, the mode, representing the most frequent value, is equally important and straightforward to find. This guide will focus specifically on How To Find The Mode, providing clear steps, examples, and a comprehensive understanding of this statistical measure.
Understanding Mode in Statistics
In statistics, the mode is the value that appears most often in a dataset. It’s one of the measures of central tendency, providing insights into the most typical or common value within a set of numbers. Unlike the mean and median, the mode is not affected by extreme values (outliers) and can be used for both numerical and categorical data. Understanding the mode is essential for quickly identifying the most prevalent data point in various scenarios.
The mode is particularly useful when dealing with:
- Categorical data: For instance, if you’re surveying favorite colors, the mode will tell you the most popular color.
- Data with repeating values: In datasets where certain values are repeated frequently, the mode highlights these common occurrences.
- Identifying trends: The mode can help pinpoint the most common trend or observation in a dataset.
While some datasets may have a single mode (unimodal), others can have multiple modes (bimodal, trimodal, or multimodal) if several values share the highest frequency. It’s also possible for a dataset to have no mode if all values appear with equal frequency.
Step-by-Step Guide: How to Find the Mode
Finding the mode is a straightforward process. Here’s a step-by-step guide to help you:
Step 1: Identify the Data Set
First, you need to have your dataset ready. This could be a list of numbers, survey responses, or any collection of data points you want to analyze.
For example, let’s consider the following dataset representing the number of hours students studied per day:
5, 6, 3, 5, 7, 5, 2, 8, 5, 4
Step 2: Count the Frequency of Each Value
Next, count how many times each value appears in your dataset. This is often easiest to do by organizing your data, either mentally for small sets or by listing them out for larger sets.
For our example dataset:
- 2 appears 1 time
- 3 appears 1 time
- 4 appears 1 time
- 5 appears 4 times
- 6 appears 1 time
- 7 appears 1 time
- 8 appears 1 time
Step 3: Determine the Mode(s)
The mode is the value (or values) that appears most frequently. Looking at our frequency count, we can see that the number 5 appears 4 times, which is more than any other number in the dataset.
Therefore, for the dataset 5, 6, 3, 5, 7, 5, 2, 8, 5, 4, the mode is 5.
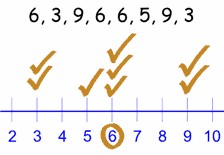 Example of calculating mode from a dataset
Alt text: Calculating the mode from a dataset example showing the number 5 appearing most frequently.
Examples of Finding the Mode
Let’s explore different examples to solidify your understanding of how to find the mode in various scenarios.
Example 1: Single Mode (Unimodal)
Consider the dataset: 12, 15, 11, 15, 18, 15, 20, 22, 15
Counting the frequencies:
- 11: 1 time
- 12: 1 time
- 15: 4 times
- 18: 1 time
- 20: 1 time
- 22: 1 time
In this case, 15 appears most frequently. Thus, the mode is 15. This is an example of a unimodal dataset, having a single mode.
Example 2: Multiple Modes (Bimodal)
Consider the dataset: 2, 3, 4, 4, 5, 5, 6, 7
Counting the frequencies:
- 2: 1 time
- 3: 1 time
- 4: 2 times
- 5: 2 times
- 6: 1 time
- 7: 1 time
Here, both 4 and 5 appear twice, which is the highest frequency. Therefore, this dataset has two modes: 4 and 5. This is known as a bimodal dataset. Datasets can also be trimodal or multimodal if they have three or more modes.
Example 3: No Mode
Consider the dataset: 1, 2, 3, 4, 5
Counting the frequencies:
- 1: 1 time
- 2: 1 time
- 3: 1 time
- 4: 1 time
- 5: 1 time
In this dataset, each number appears only once. Since no value is repeated more than others, this dataset has no mode. This occurs when all values in a dataset have the same frequency.
Mode vs. Mean and Median: Choosing the Right Measure
While mean, median, and mode are all measures of central tendency, they represent different aspects of a typical value and are appropriate for different situations.
- Mean: The average value, calculated by summing all values and dividing by the count. Sensitive to outliers. Best for symmetrical data without extreme values.
- Median: The middle value when data is ordered. Less sensitive to outliers than the mean. Good for skewed data or when outliers are present.
- Mode: The most frequent value. Useful for categorical data and identifying common occurrences. Not sensitive to outliers.
Choosing the right measure depends on the nature of your data and what you want to represent. The mode is particularly valuable when you want to know the most common value in a dataset, especially when dealing with categories or datasets with frequent repetitions.
Conclusion
Finding the mode is a fundamental skill in statistics, offering a quick way to identify the most frequent value in a dataset. By following the simple steps outlined in this guide, you can easily determine the mode, whether you’re dealing with unimodal, bimodal, multimodal datasets, or even datasets with no mode. Understanding how to find the mode enhances your ability to analyze data and draw meaningful conclusions about the most typical values within any given set. Practice these steps with different datasets to master this essential statistical concept and further your data analysis skills.